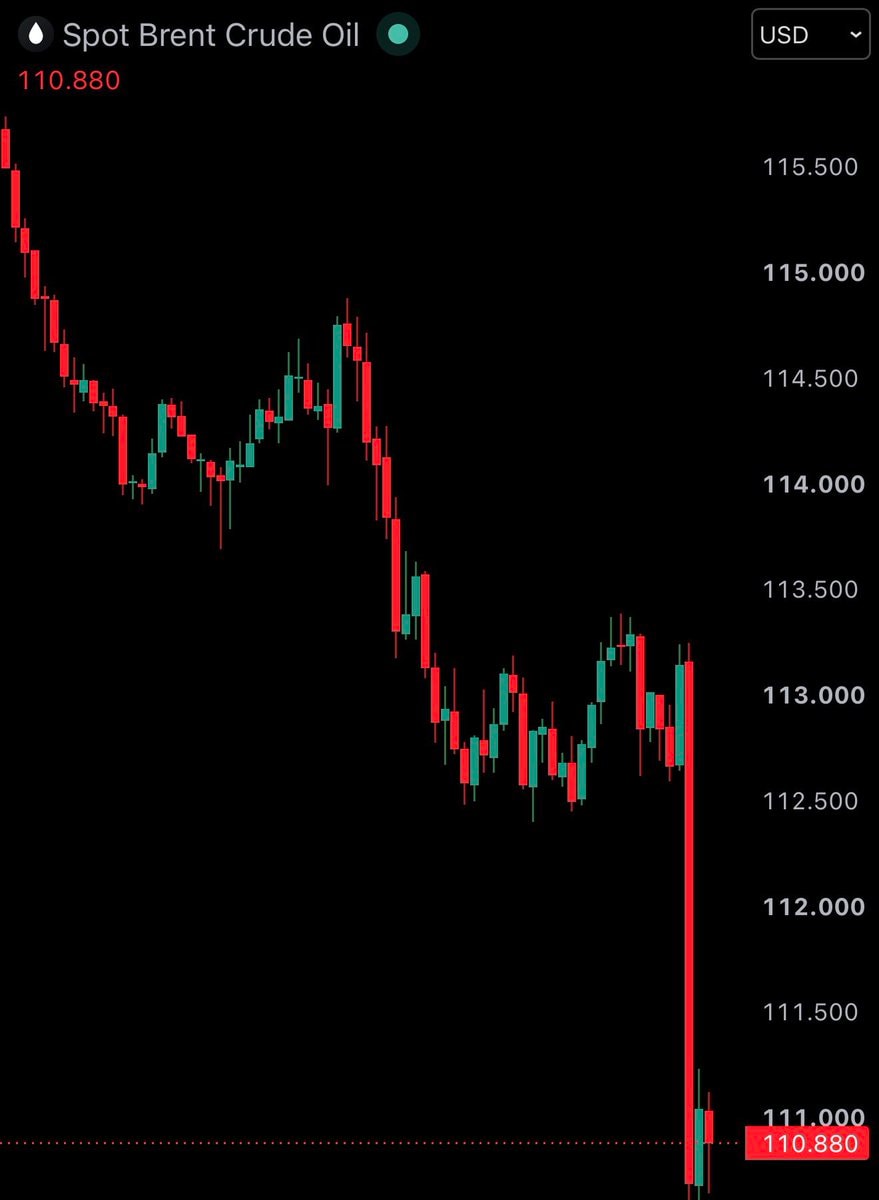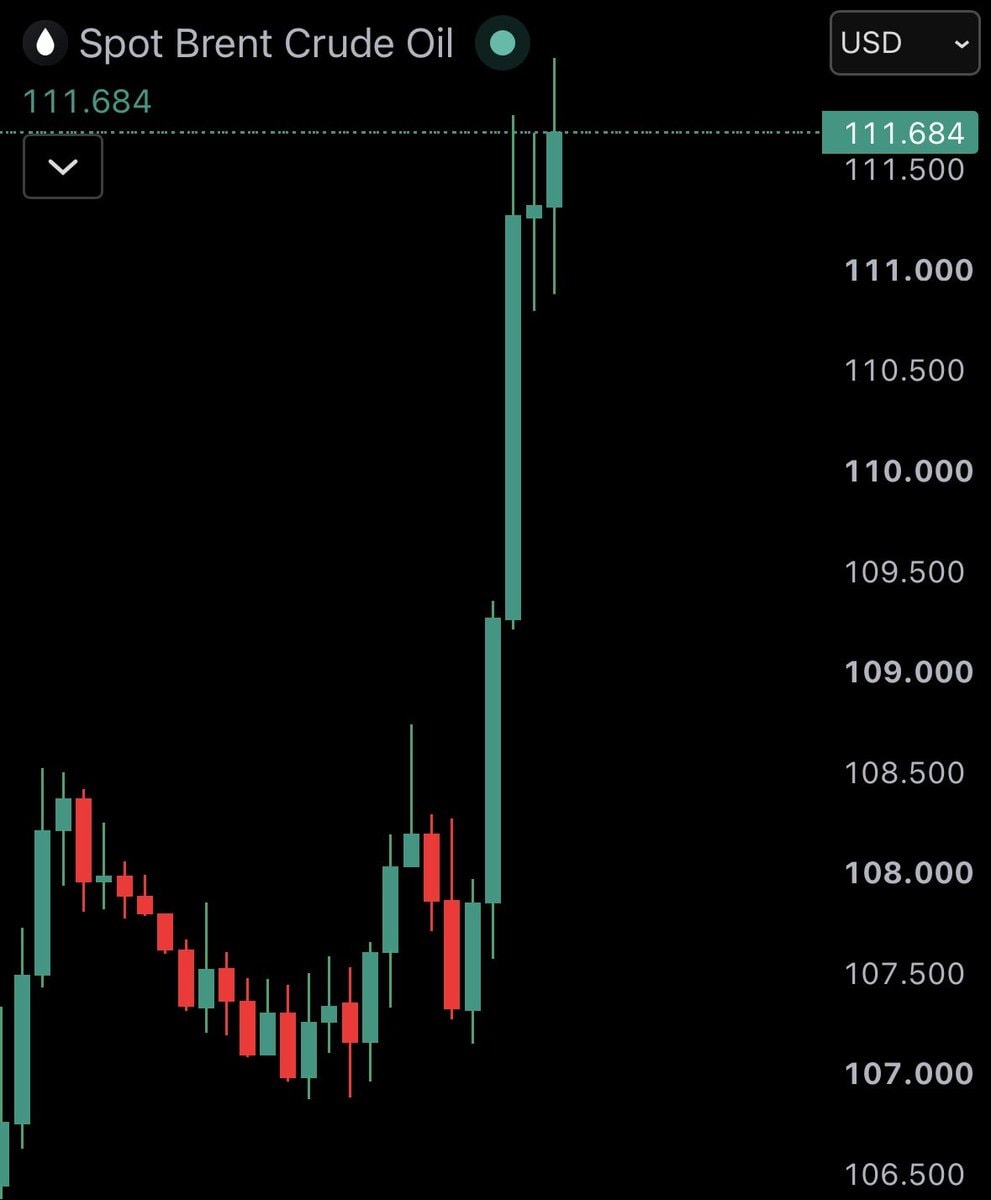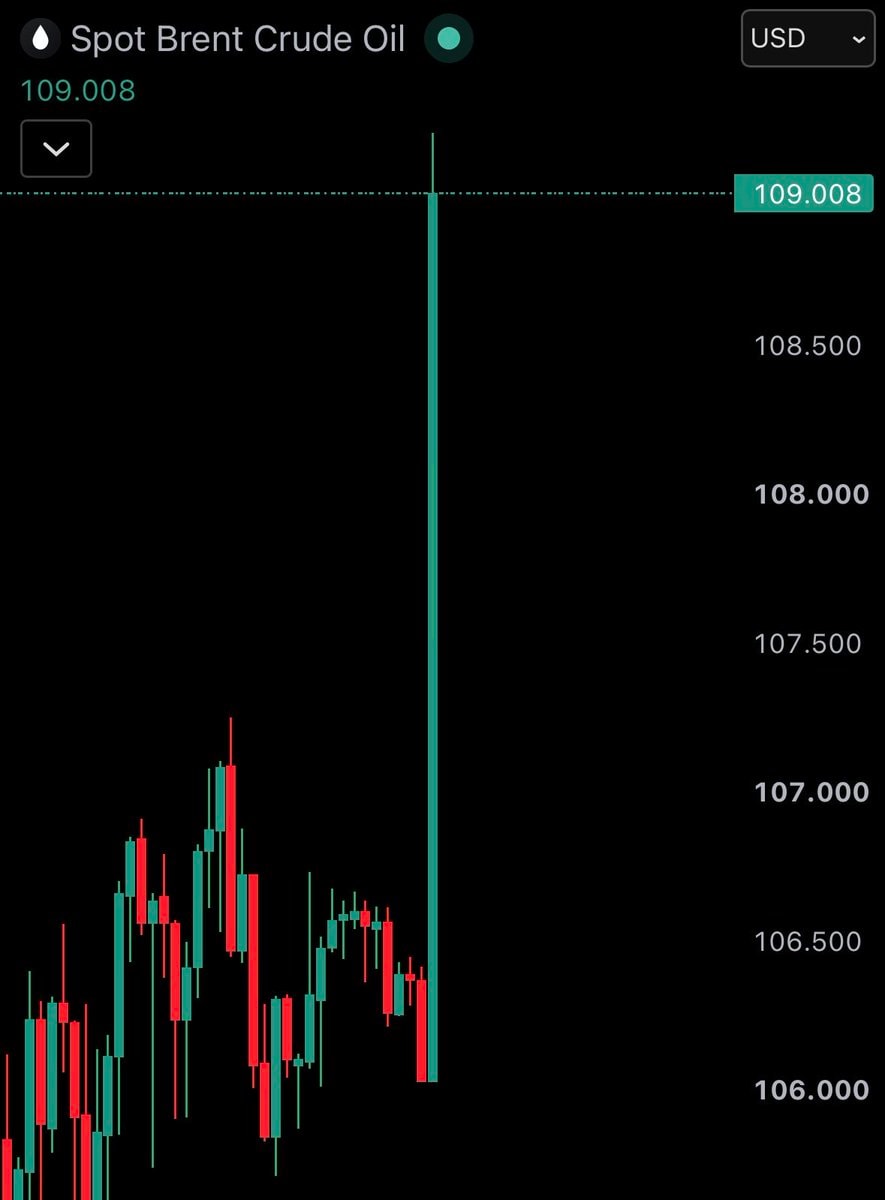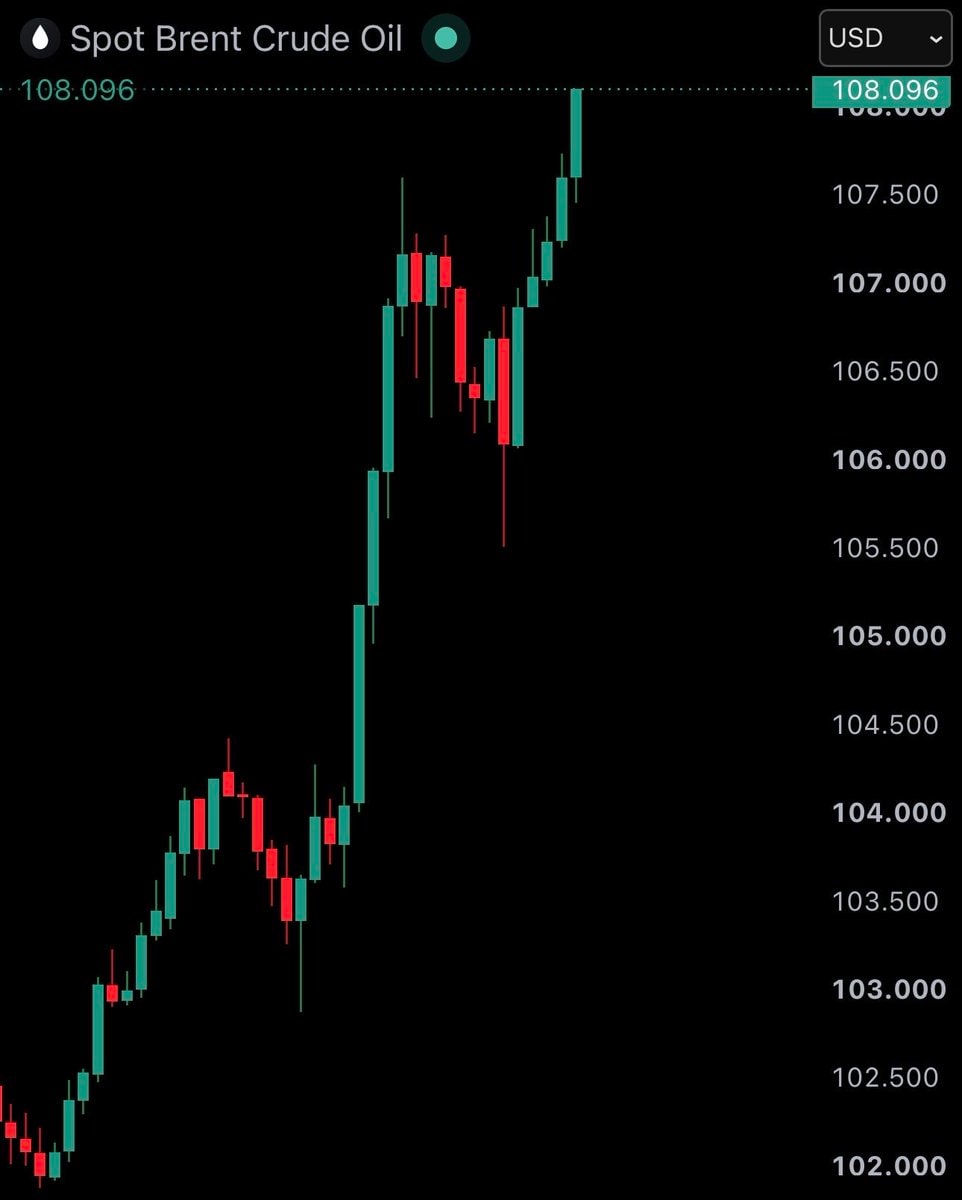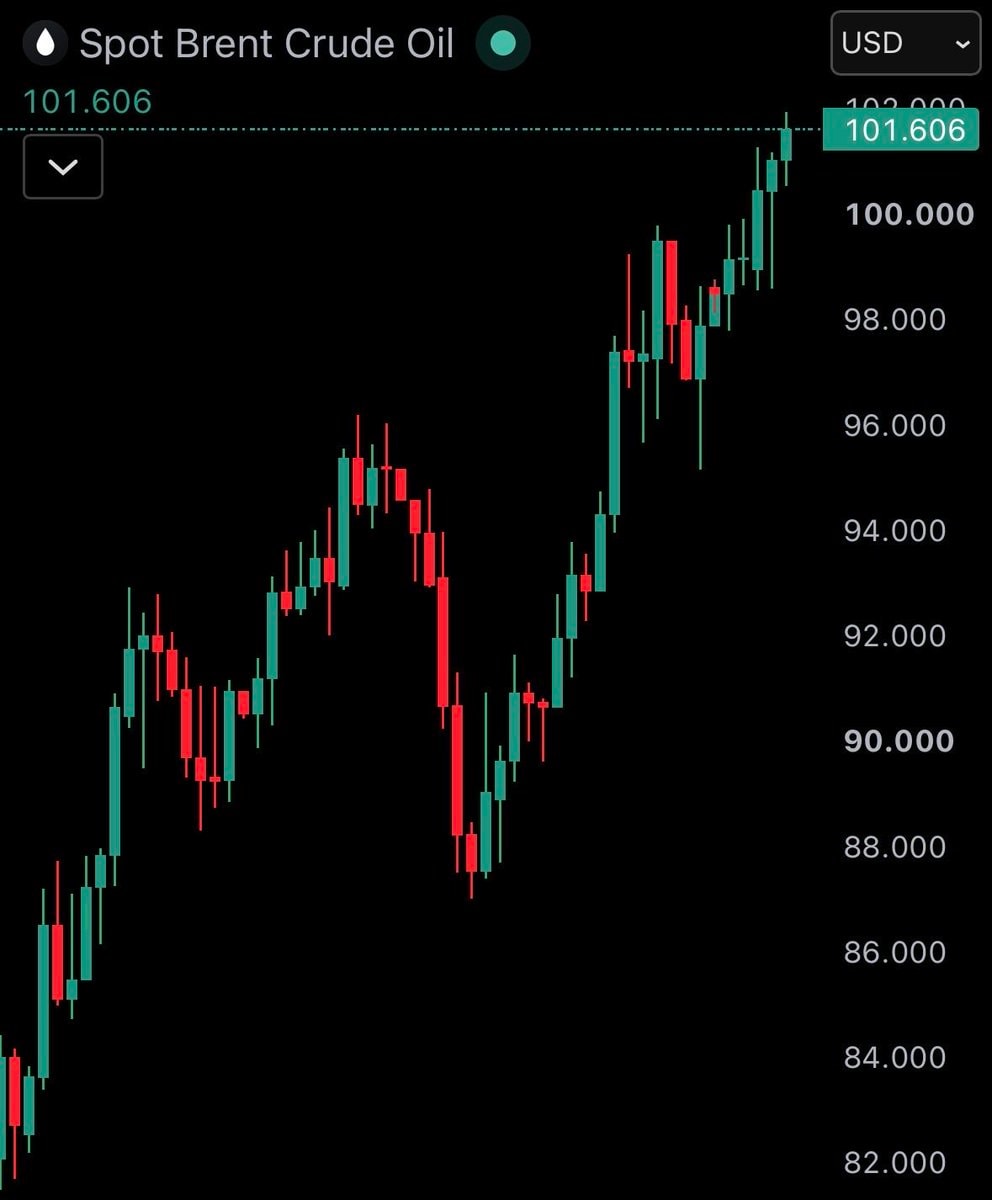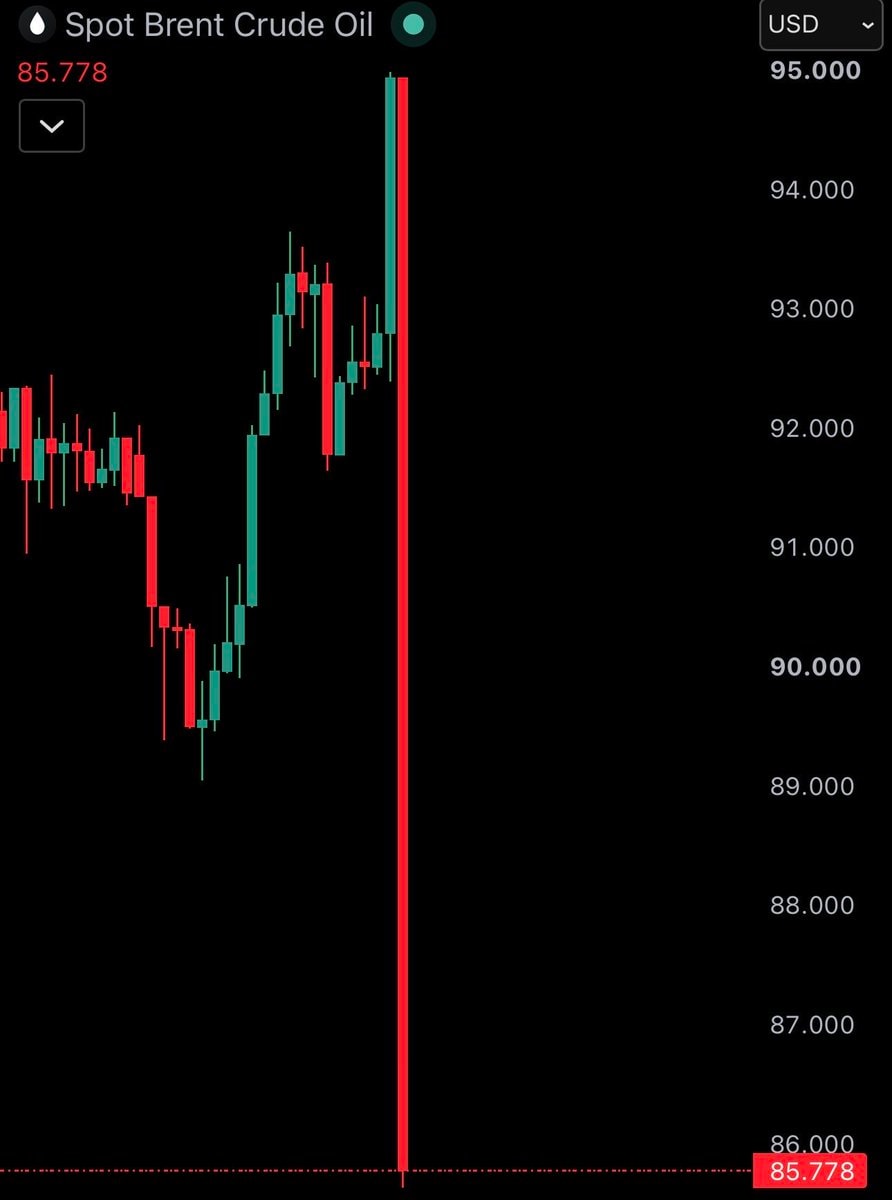
@gabriel_kBrent crude dropped below $100 per barrel after the U.S. midterm elections.
View original post@gabriel_kBrent crude dropped below $100 per barrel after the U.S. midterm elections.
View original postPhoto by @gabriel_k· Nov 4, 2026· Brent Crude Oil
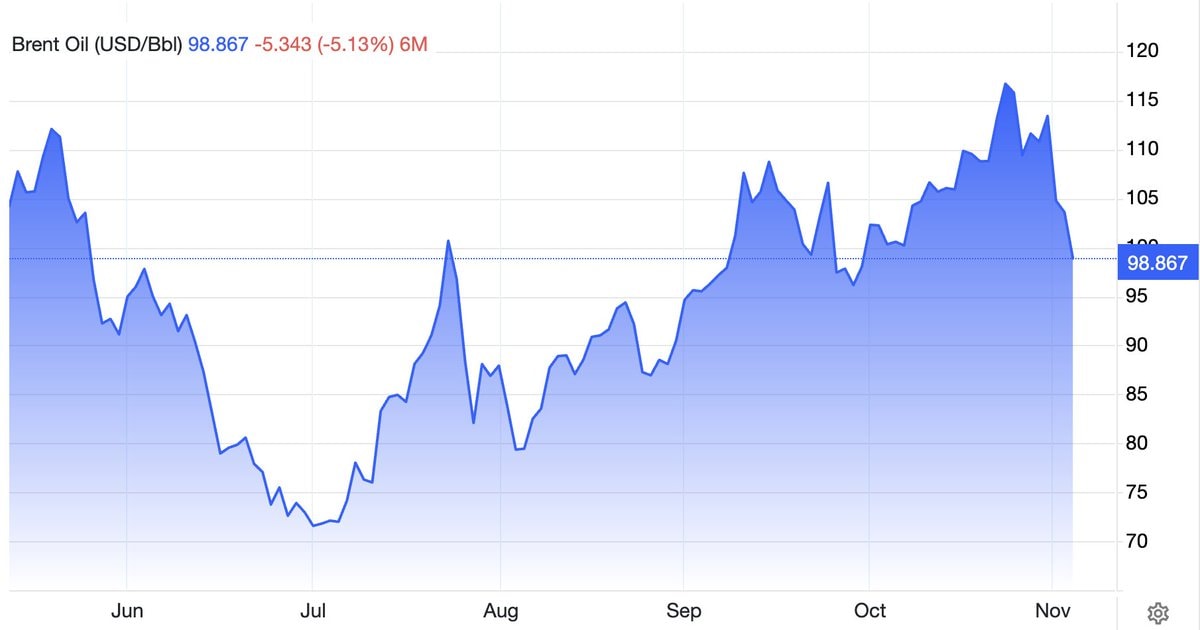
The image is a 6-month price chart for Brent Oil in USD per barrel. The blue area graph shows the commodity's price movement from June through early November, starting near 110, plunging to a low around 70 in July, then climbing with volatility through the fall to peak above 115 in October before settling at the current price of 98.867. On-screen text at the top reads "Brent Oil (USD/Bbl) 98.867 -5.343 (-5.13%) 6M" with the current value highlighted on the right axis. The overall mood is that of a financial news graphic displaying a significant recent downturn after a strong rally.
@gabriel_kBrent crude dropped below $100 per barrel after the U.S. midterm elections.
View original postPhoto by @gabriel_k· Nov 4, 2026· Brent Crude Oil
The image is a 6-month price chart for Brent Oil in USD per barrel. The blue area graph shows the commodity's price movement from June through early November, starting near 110, plunging to a low around 70 in July, then climbing with volatility through the fall to peak above 115 in October before settling at the current price of 98.867. On-screen text at the top reads "Brent Oil (USD/Bbl) 98.867 -5.343 (-5.13%) 6M" with the current value highlighted on the right axis. The overall mood is that of a financial news graphic displaying a significant recent downturn after a strong rally.