iFANN
    Search iFANN...
    Log in
    Home
    News
    Videos
    Photos
    GIFs
    Explore
    Polls
    Awards
    iFAMOUS
    Wiki
    Anime
    Rooms
    Notifications
    Messages
    Bookmarks
    Profile
    WikiAwardsiFAMOUSRankingsIndustriesCreator RewardsUser RewardsTermsPrivacyCommunity GuidelinesTakedown / DMCAHelpDevelopers

    ยฉ 2026 iFANN

    Home
    Search
    Messages
    Alerts
    Profile
    Photo
    ๐Ÿ† Jakob Eras
    ๐Ÿ† Jakob Eras@Jakob.eras1mo
    ๐Ÿ“ฑBrent Crude Oil๐Ÿ’ญFinance๐Ÿ’ญInvesting
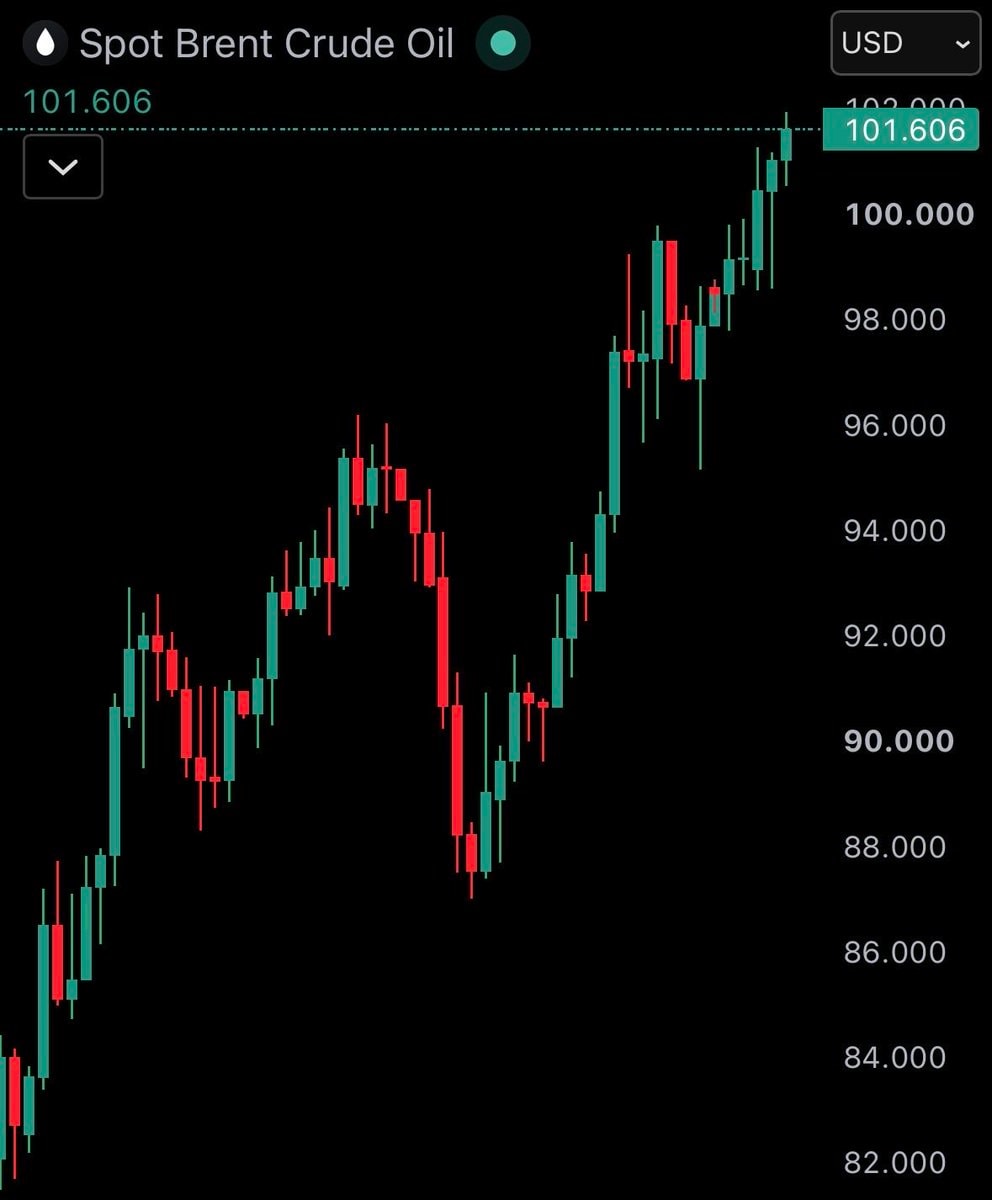
    Brent crude oil price chart

    @Jakob.erasBrent crude oil prices have risen above $100 per barrel and this level has not been reached since July

    View original post

    Brent crude oil price chart

    Photo by @Jakob.erasยท Sep 9, 2026ยท Brent Crude Oil

    About this photo

    The focus is a financial chart displaying the price of Spot Brent Crude Oil. The chart shows a candlestick graph with green and red candles indicating price movements over time, trending upwards. The mood is informative and data-driven, typical of financial market analysis. A notable detail is the current price displayed prominently at the top right. ON-SCREEN TEXT: Spot Brent Crude Oil, USD, 101.606, 100.000, 98.000, 96.000, 94.000, 92.000, 90.000, 88.000, 86.000, 84.000, 82.000
    See all Brent Crude Oil photosRead the Brent Crude Oil wiki

    ?

    More Brent Crude Oil photos

    See all Brent Crude Oil photos
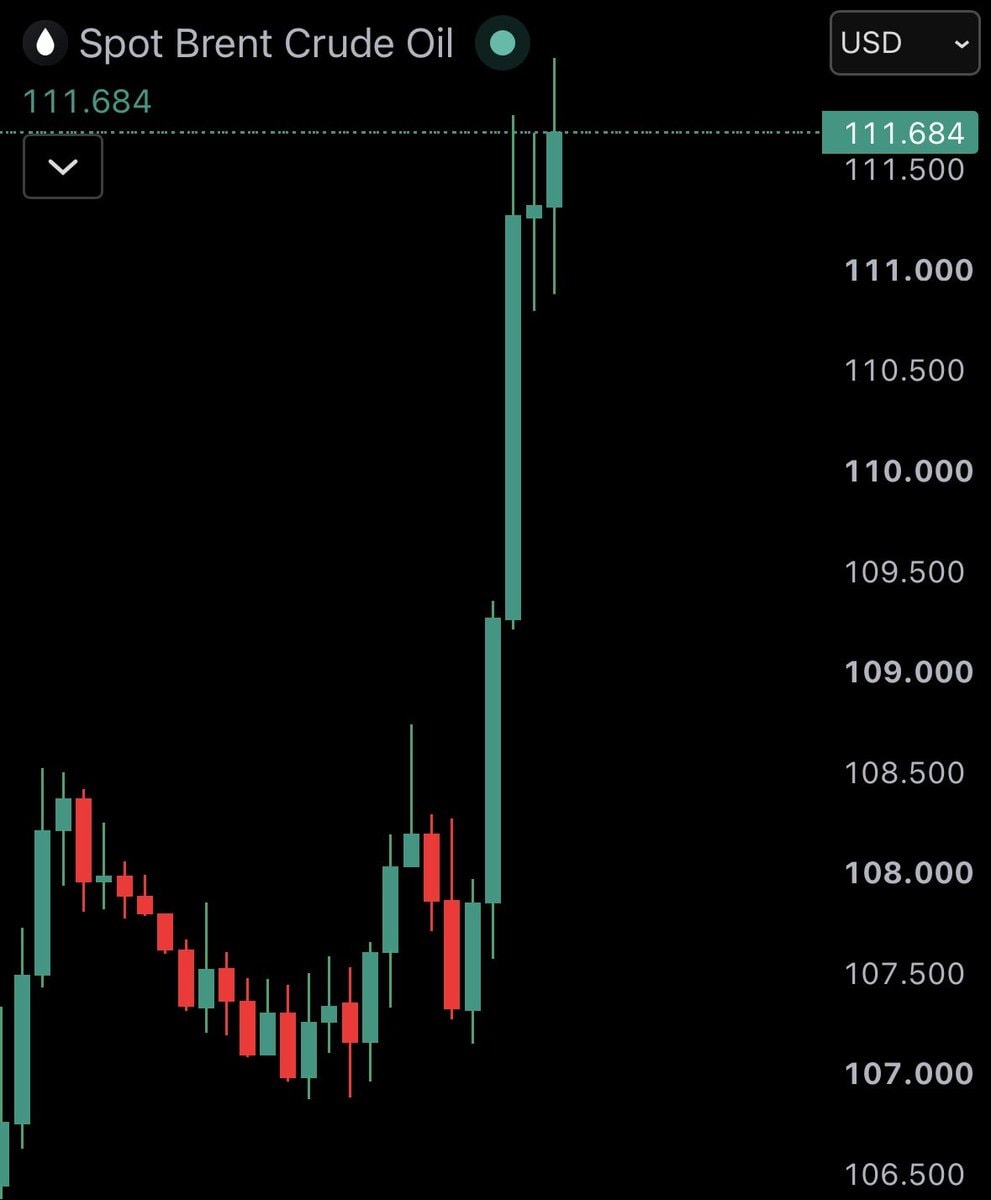
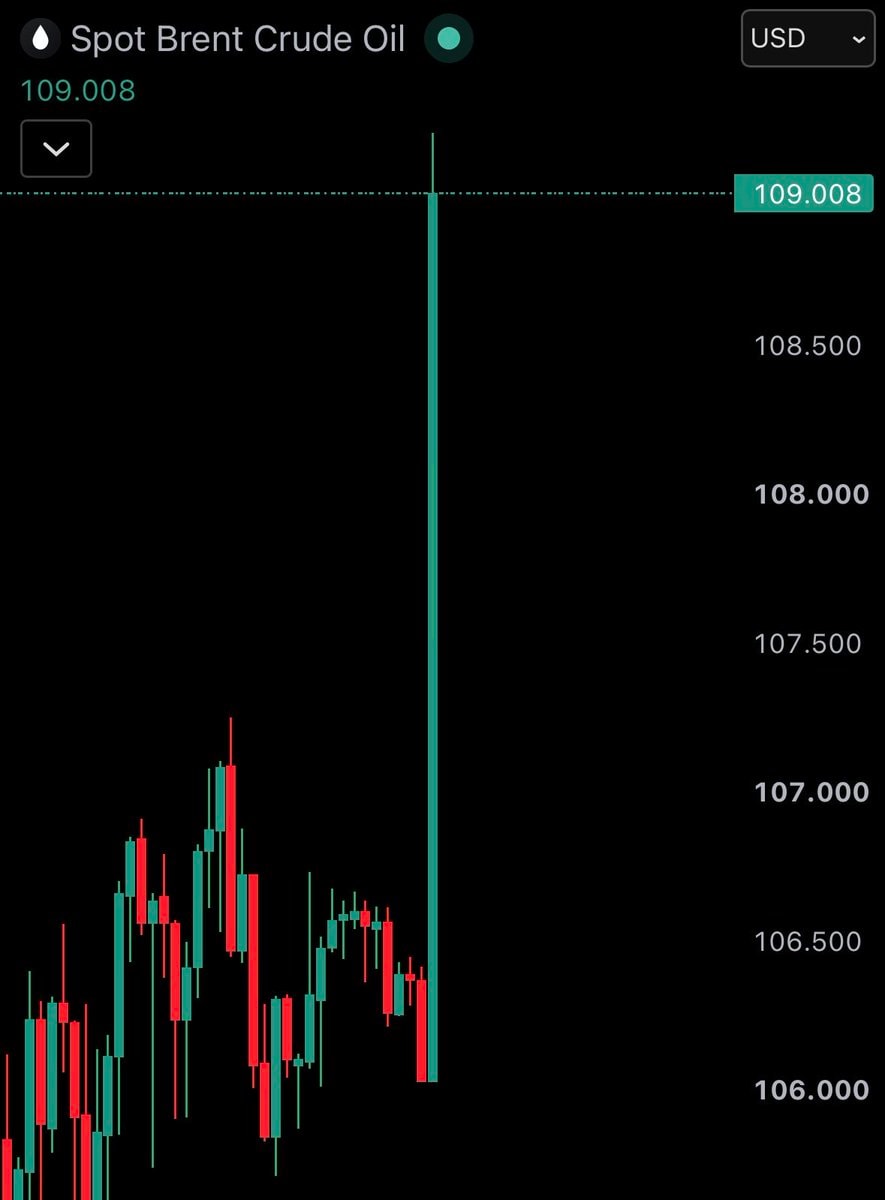
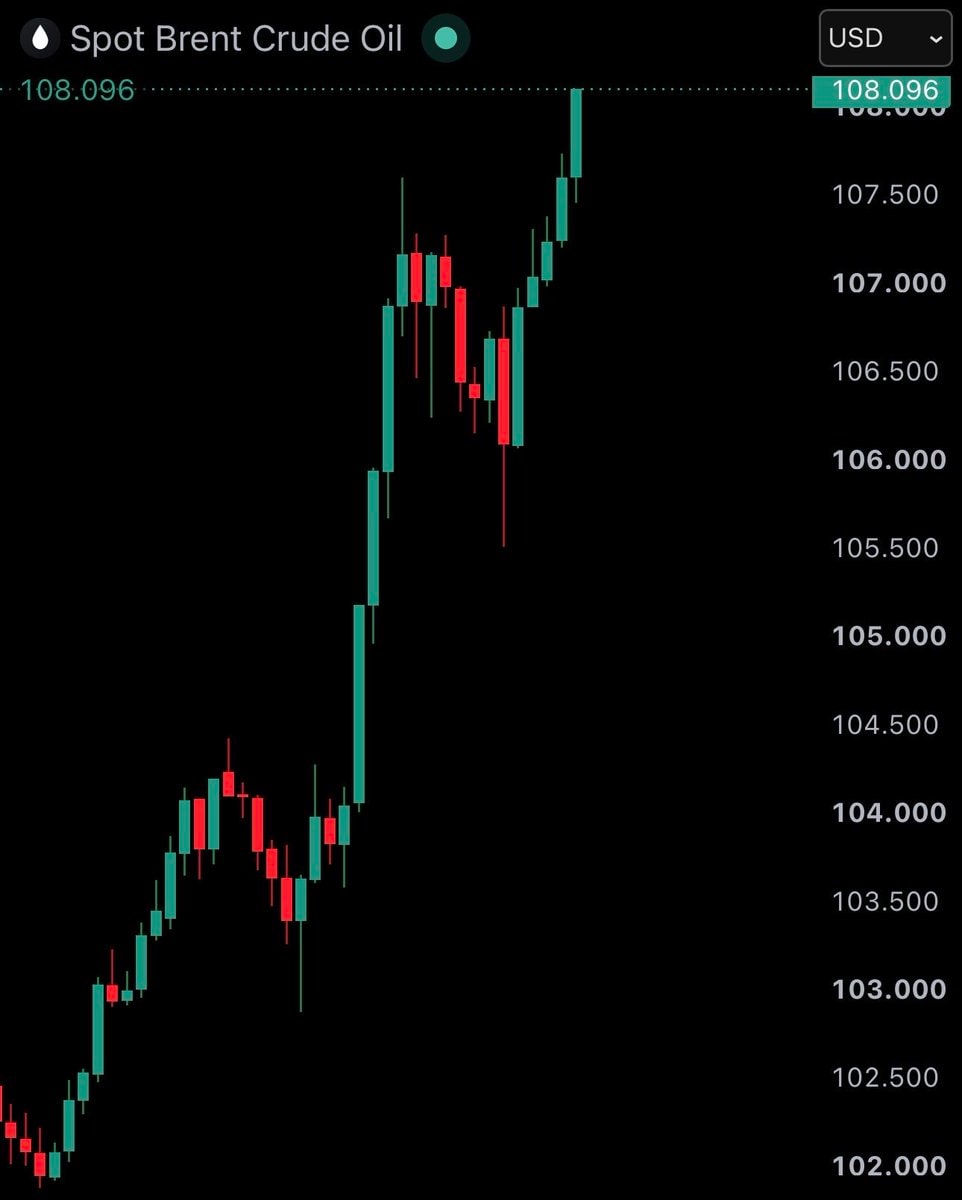
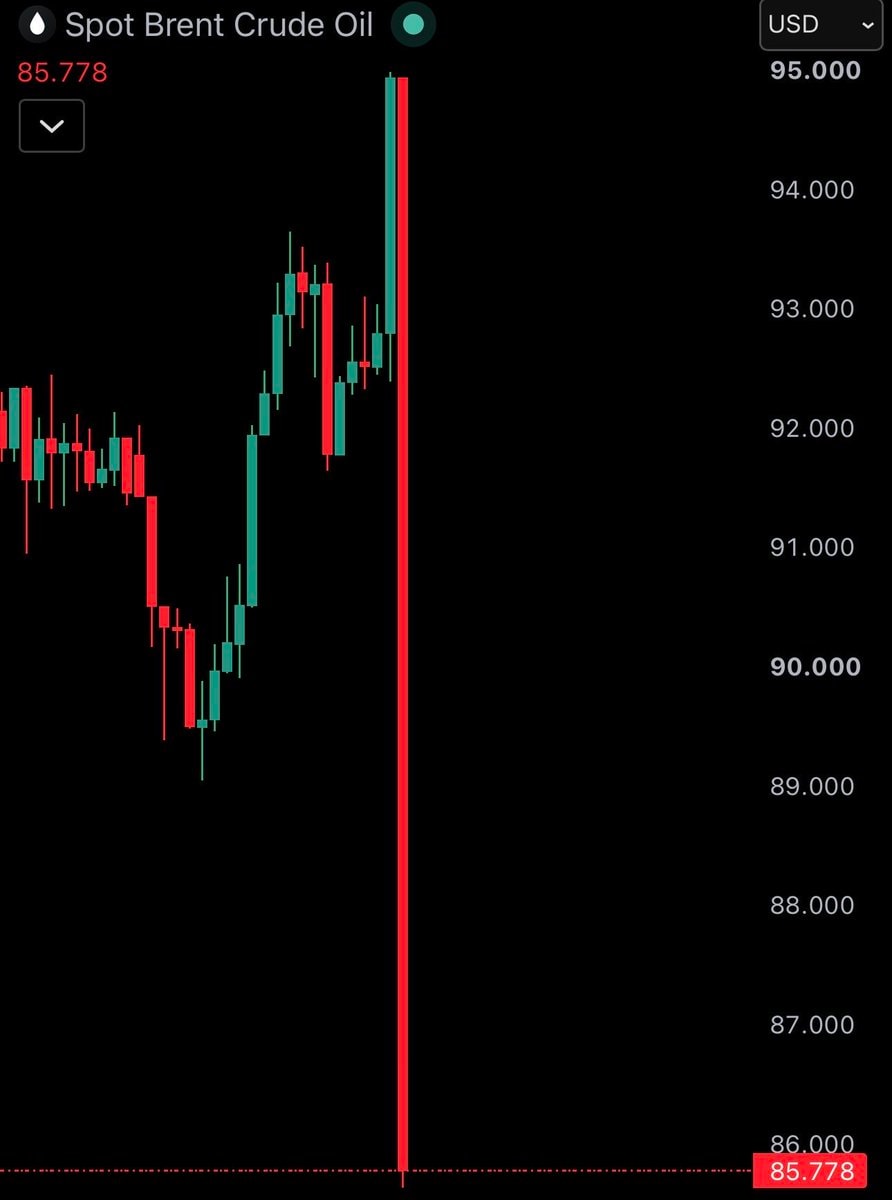
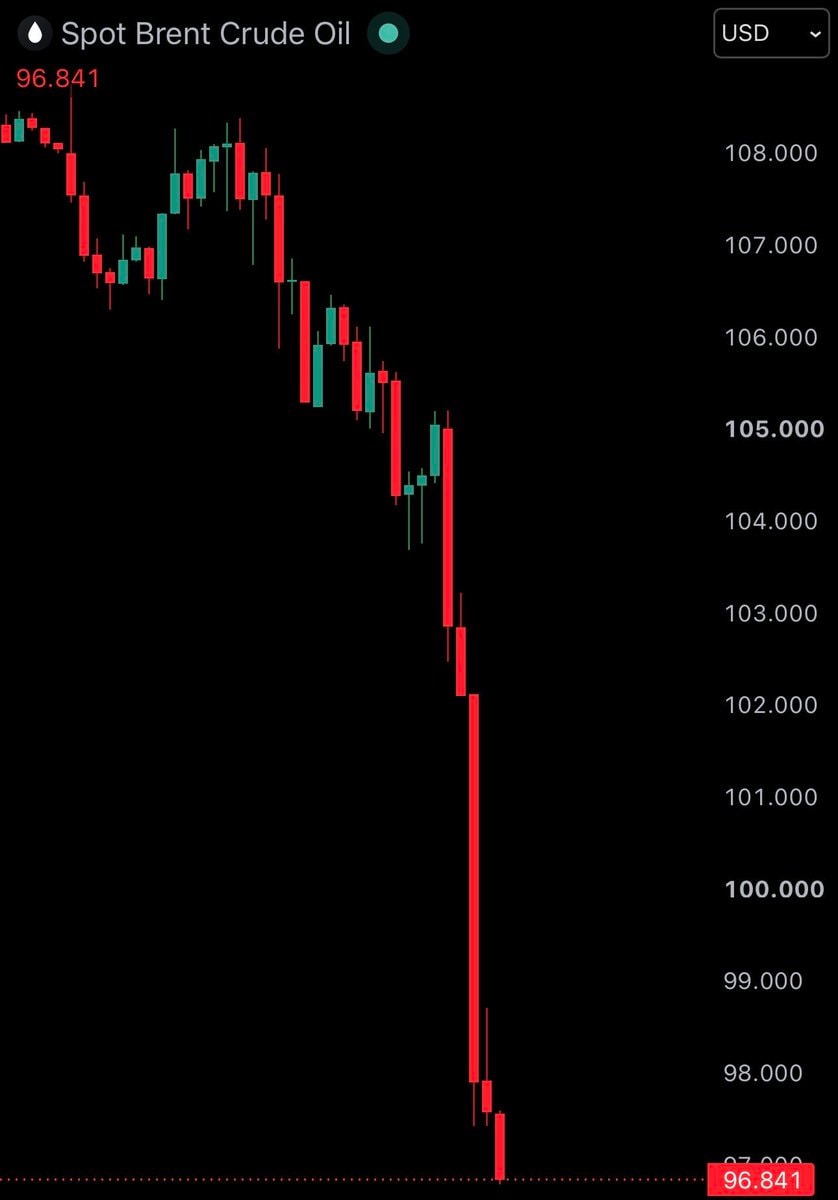
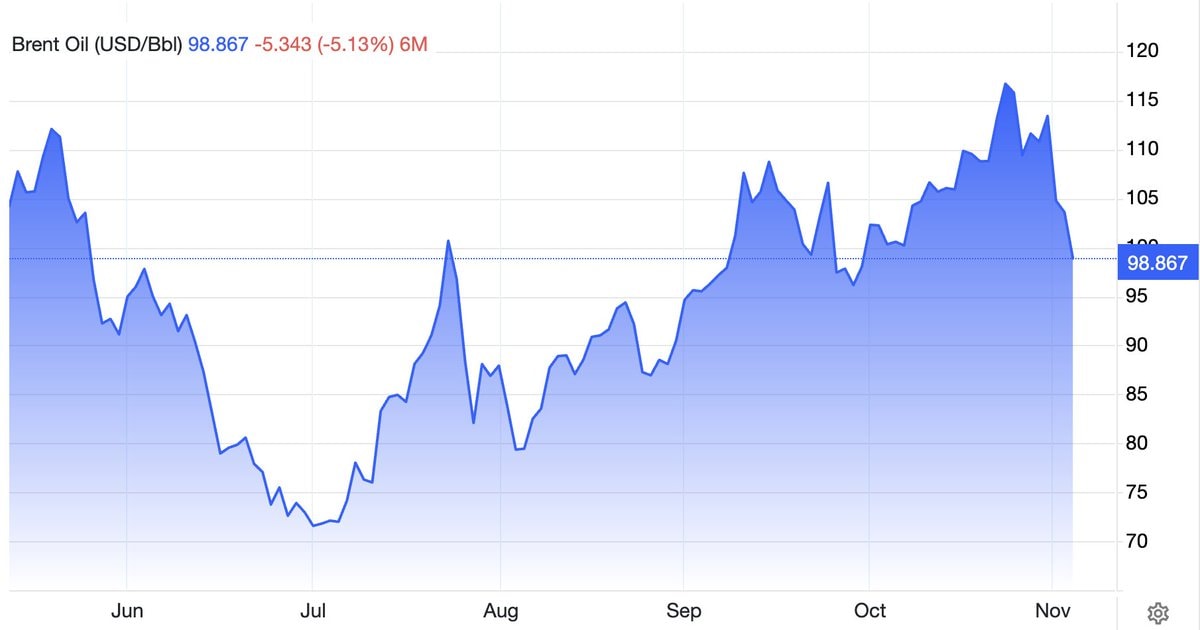
    Brent crude oil chartBrent crude oil chartBrent crude price chartBrent crude price chartBrent Crude Oil price dropBrent Crude Oil price dropBrent crude oil price chartBrent crude oil price chartBrent crude oil price surgeBrent crude oil price surgeBrent Crude Oil price chartBrent Crude Oil price chartBrent Crude Oil 10% drop after US Iran haltBrent Crude Oil 10% drop after US Iran haltBrent crude oil falls to $752Brent crude oil falls to $75
    Photo
    ๐Ÿ† Jakob Eras
    ๐Ÿ† Jakob Eras@Jakob.eras1mo
    ๐Ÿ“ฑBrent Crude Oil๐Ÿ’ญFinance๐Ÿ’ญInvesting
    Brent crude oil price chart

    @Jakob.erasBrent crude oil prices have risen above $100 per barrel and this level has not been reached since July

    View original post

    Brent crude oil price chart

    Photo by @Jakob.erasยท Sep 9, 2026ยท Brent Crude Oil

    About this photo

    The focus is a financial chart displaying the price of Spot Brent Crude Oil. The chart shows a candlestick graph with green and red candles indicating price movements over time, trending upwards. The mood is informative and data-driven, typical of financial market analysis. A notable detail is the current price displayed prominently at the top right. ON-SCREEN TEXT: Spot Brent Crude Oil, USD, 101.606, 100.000, 98.000, 96.000, 94.000, 92.000, 90.000, 88.000, 86.000, 84.000, 82.000
    See all Brent Crude Oil photosRead the Brent Crude Oil wiki

    ?

    More Brent Crude Oil photos

    See all Brent Crude Oil photos
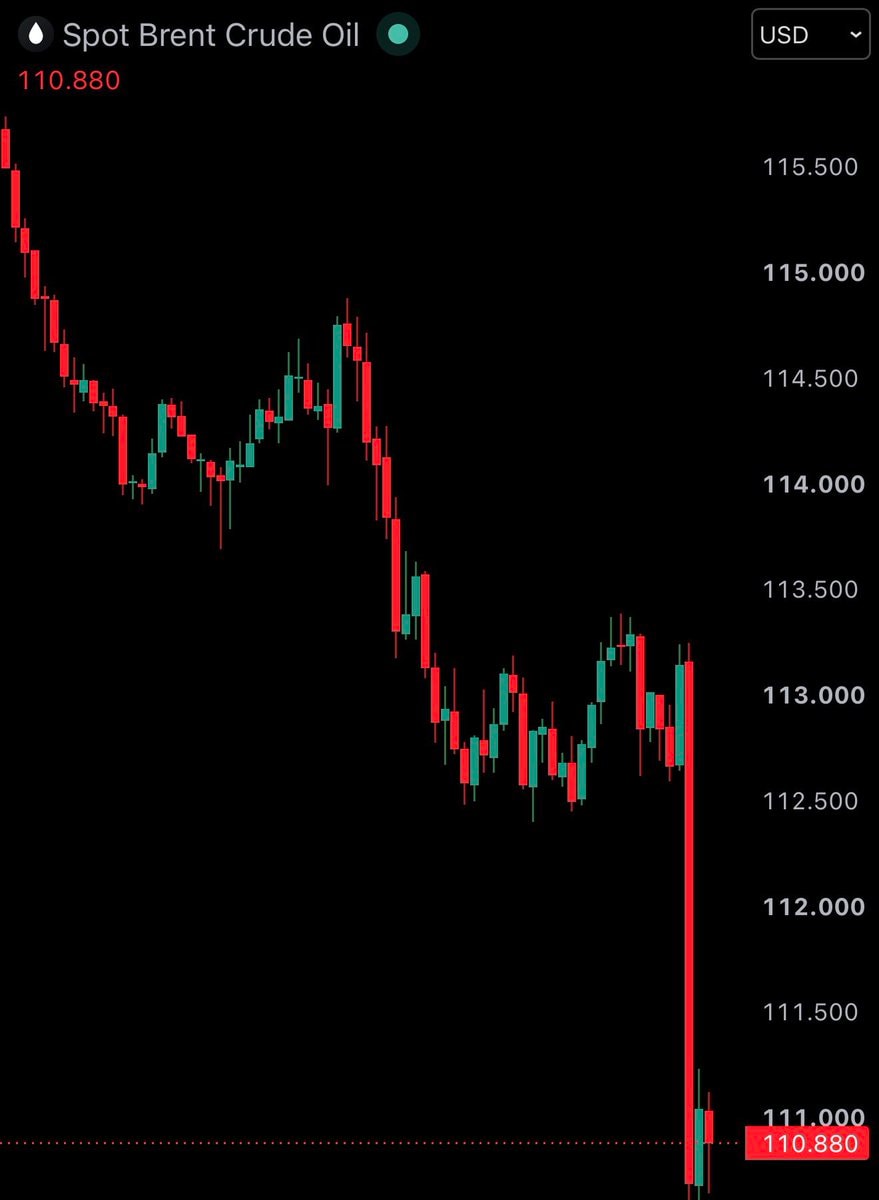
    Brent crude oil chartBrent crude oil chartBrent crude price chartBrent crude price chartBrent Crude Oil price dropBrent Crude Oil price dropBrent crude oil price chartBrent crude oil price chartBrent crude oil price surgeBrent crude oil price surgeBrent Crude Oil price chartBrent Crude Oil price chartBrent Crude Oil 10% drop after US Iran haltBrent Crude Oil 10% drop after US Iran haltBrent crude oil falls to $752Brent crude oil falls to $75