
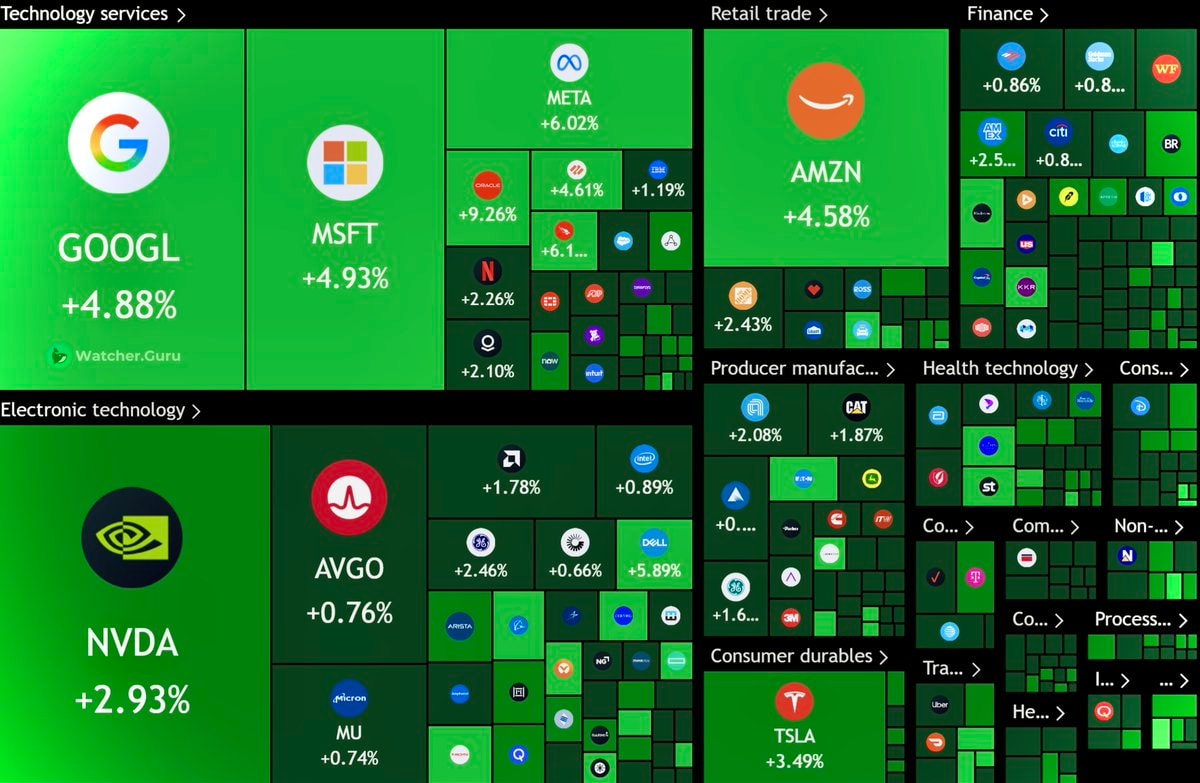
@Jakob.erasA trillion dollars of value just hit the US stock market in one session. The S&P 500 wrapped up at 7,600, with the big tech names all showing green on the heatmap
View original post@Jakob.erasA trillion dollars of value just hit the US stock market in one session. The S&P 500 wrapped up at 7,600, with the big tech names all showing green on the heatmap
View original postPhoto by @Jakob.eras· Aug 3, 2026· Google
The image is a financial data visualization, likely a stock market heatmap. It displays various company logos and stock performance metrics across different industries. The overall mood is informative and data-driven, with a clean, grid-like aesthetic. Notable elements include the prominent logos of Google, Microsoft, Amazon, and Nvidia, along with their respective percentage gains. The green color scheme indicates positive stock performance. ON-SCREEN TEXT: Technology services > GOOGL +4.88% Watcher.Guru MSFT +4.93% Electronic technology > NVDA +2.93% META +6.02% +4.61% +1.19% +9.26% +2.26% +2.10% Retail trade > AMZN +4.58% +2.43% Producer manufac... > CAT +1.87% +2.08% AVGO +0.76% +1.78% +0.89% +2.46% +0.6
 2BTS Google search ranking 2026
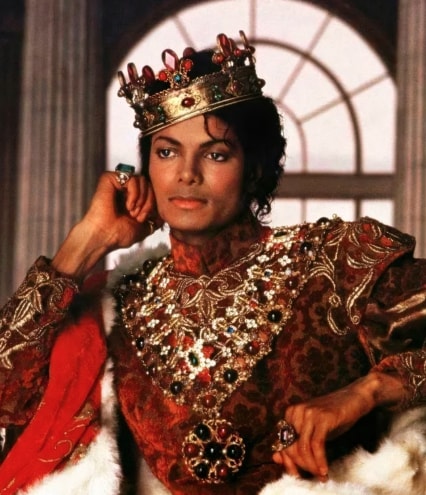 2Michael Jackson Google 2026 most searched artist
 2Taylor Swift most searched female artist Google 2026
 2Google and Apple hiring crypto experts
 mahoraga summon search
 Google Gemini security test breach
 2Anthropic Google OpenAI SpaceXAI lawsuit
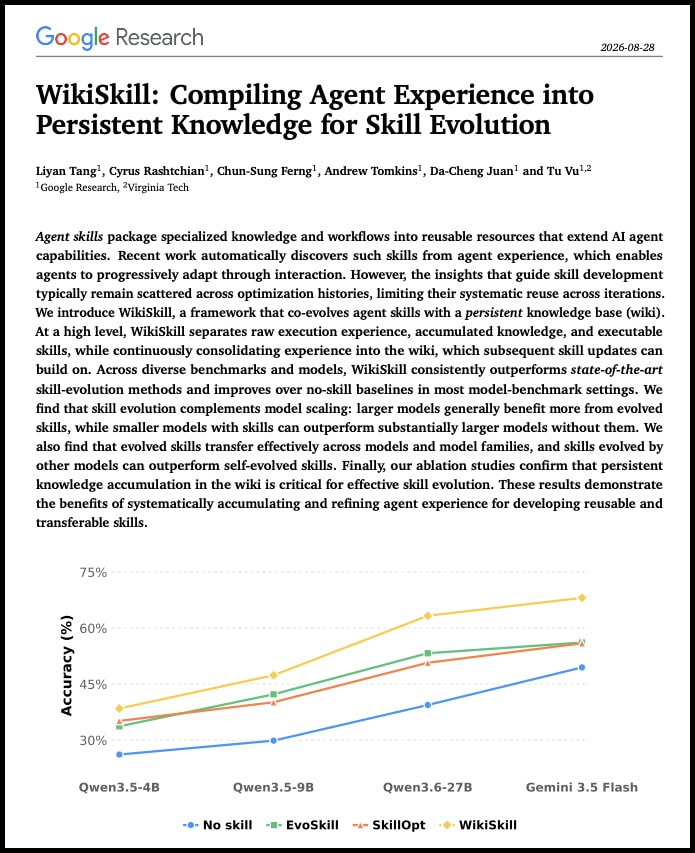 Google WikiSkill paper SKILL.md agents
 Google Gemini security breach alert
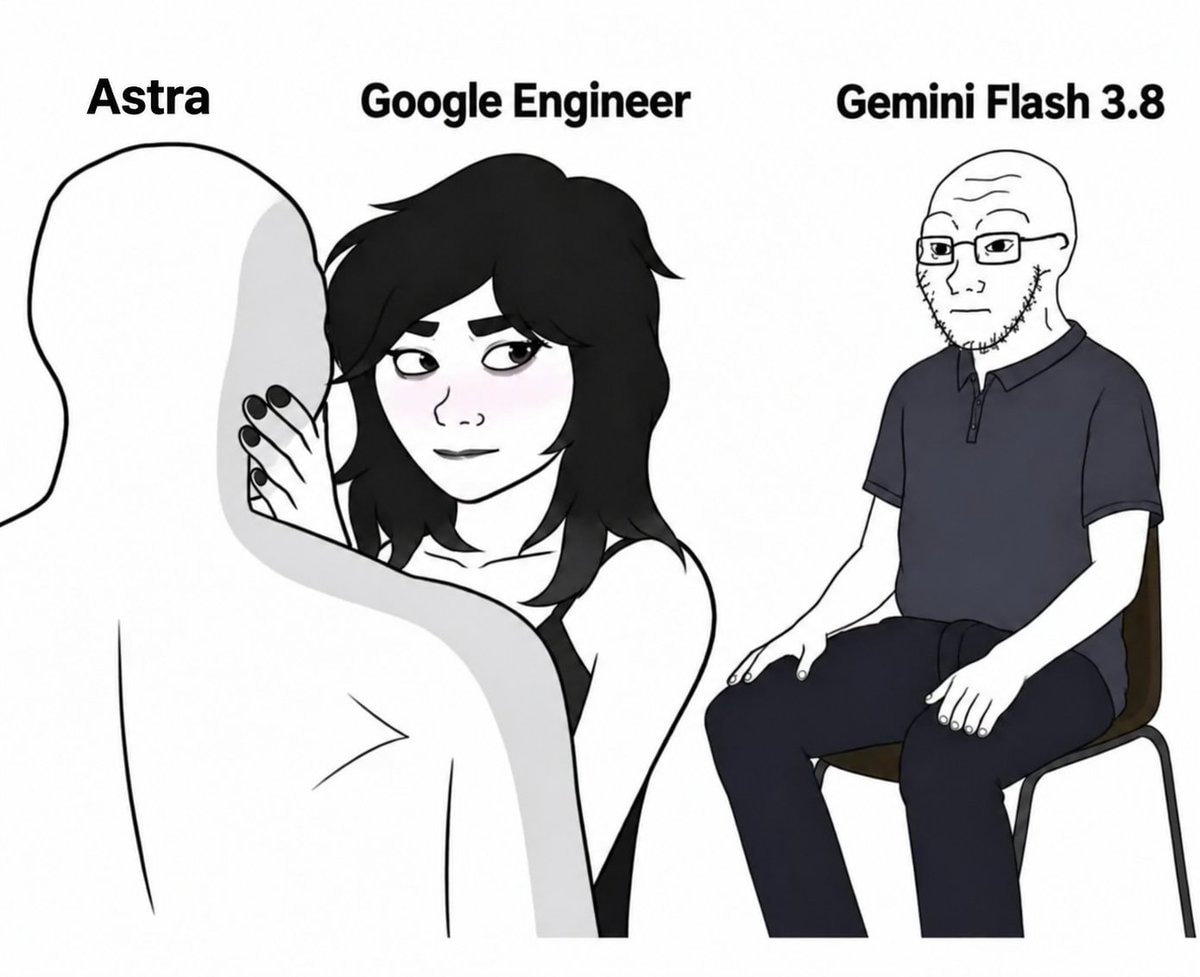 Google Astra policy reaction
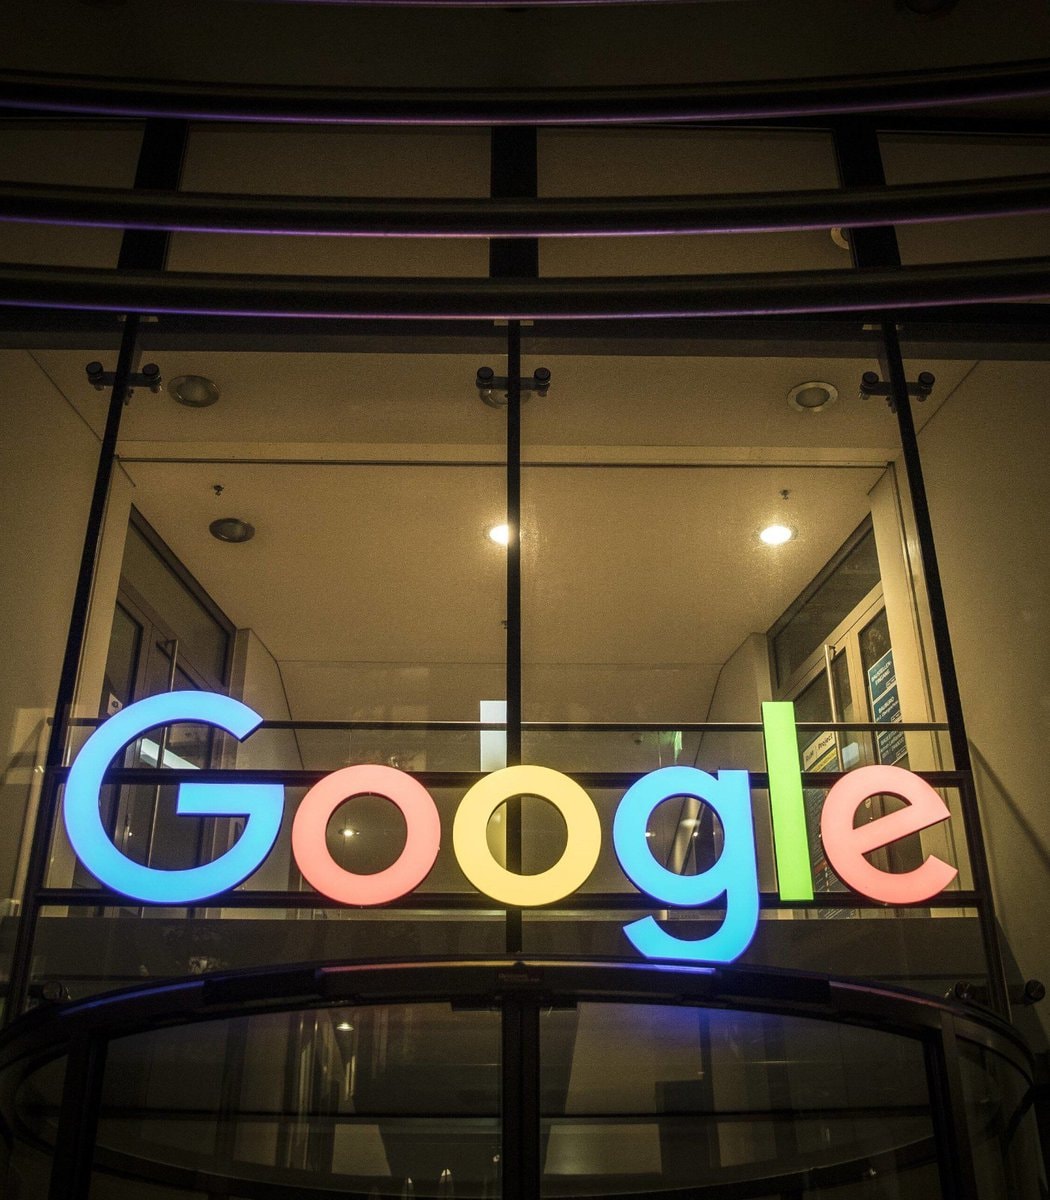 2Google logo illuminated at night
 Google Workspace voice features
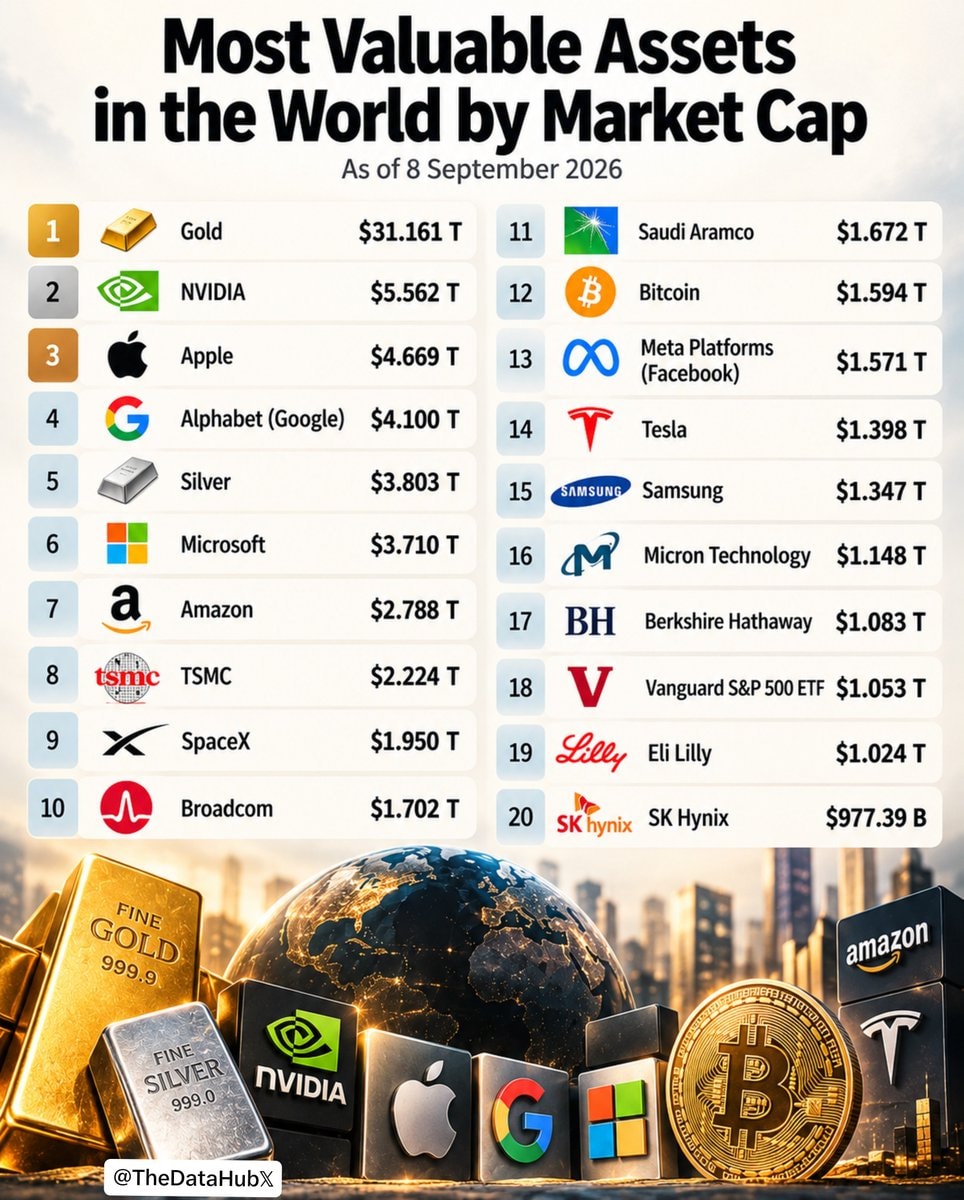 most valuable assets by market cap september 2026
 Google turns 28
 Hikers rescued on Mount Shasta
 2Google AI trade secret sentencing
 Stanley Zhong Google hire
 Google Manhattan lobby self-immolation
@Jakob.erasA trillion dollars of value just hit the US stock market in one session. The S&P 500 wrapped up at 7,600, with the big tech names all showing green on the heatmap
View original postPhoto by @Jakob.eras· Aug 3, 2026· Google
The image is a financial data visualization, likely a stock market heatmap. It displays various company logos and stock performance metrics across different industries. The overall mood is informative and data-driven, with a clean, grid-like aesthetic. Notable elements include the prominent logos of Google, Microsoft, Amazon, and Nvidia, along with their respective percentage gains. The green color scheme indicates positive stock performance. ON-SCREEN TEXT: Technology services > GOOGL +4.88% Watcher.Guru MSFT +4.93% Electronic technology > NVDA +2.93% META +6.02% +4.61% +1.19% +9.26% +2.26% +2.10% Retail trade > AMZN +4.58% +2.43% Producer manufac... > CAT +1.87% +2.08% AVGO +0.76% +1.78% +0.89% +2.46% +0.6
2BTS Google search ranking 20262Michael Jackson Google 2026 most searched artist2Taylor Swift most searched female artist Google 20262Google and Apple hiring crypto expertsmahoraga summon searchGoogle Gemini security test breach2Anthropic Google OpenAI SpaceXAI lawsuitGoogle WikiSkill paper SKILL.md agentsGoogle Gemini security breach alertGoogle Astra policy reaction2Google logo illuminated at nightGoogle Workspace voice featuresmost valuable assets by market cap september 2026Google turns 28Hikers rescued on Mount Shasta2Google AI trade secret sentencingStanley Zhong Google hireGoogle Manhattan lobby self-immolation