About this photo
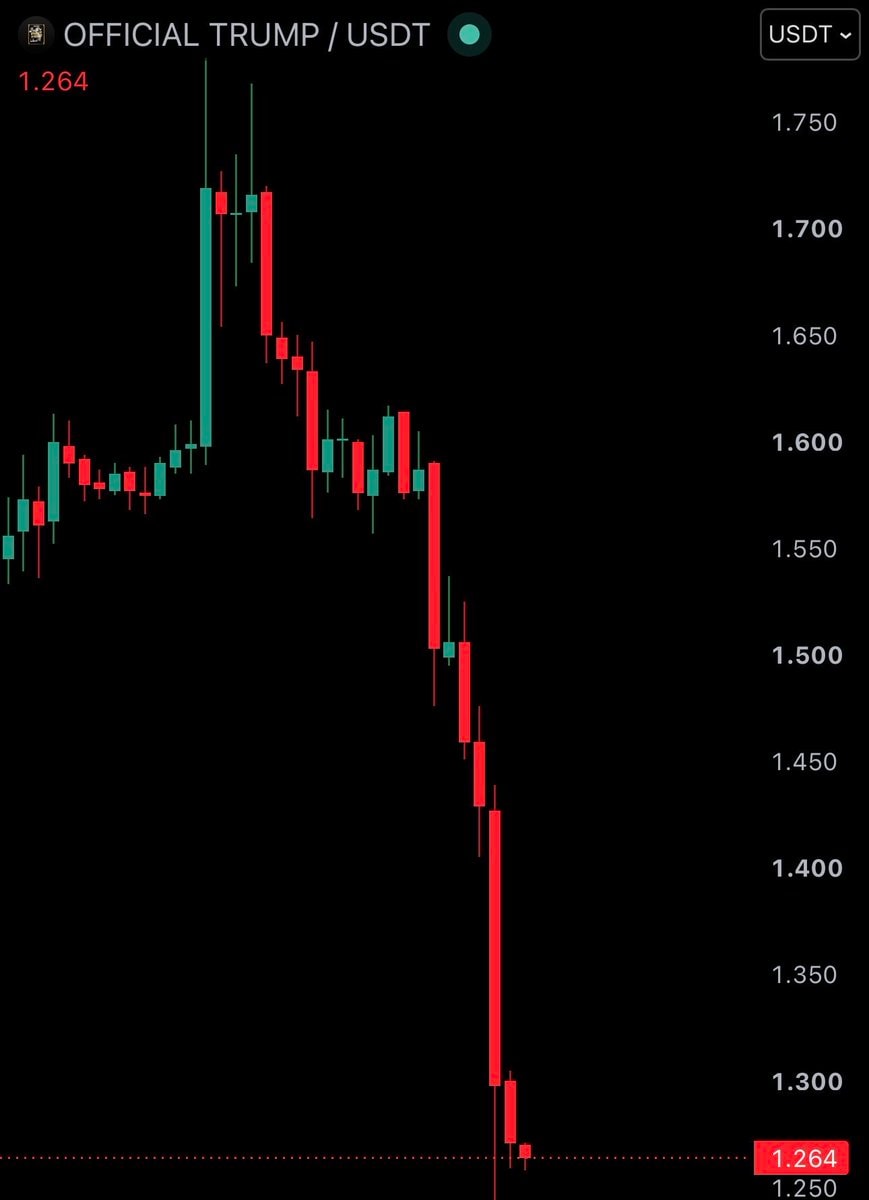
The image is a dark-themed candlestick chart for OFFICIAL TRUMP / USDT. A massive green candle spikes sharply upward near the left, followed by a series of smaller green and red candles before a steep, sustained decline of large red candles that drives the price from above 1.70 all the way down to the current level of 1.264. The mood is tense and bearish, with the final red candles dominating the right side of the frame. Visually notable is the dramatic vertical drop in the latter half of the chart and the horizontal dotted line at the bottom marking the 1.264 support level. On-screen text reads exactly: OFFICIAL TRUMP / USDT, 1.264, and USDT.