


@patel.aminataEvery demographic group moved toward Democratic candidates in 2026 compared with 2024, per The New York Times. The paper's breakdown covers gender, race, age and education, and the shift shows up in all of them
View original post@patel.aminataEvery demographic group moved toward Democratic candidates in 2026 compared with 2024, per The New York Times. The paper's breakdown covers gender, race, age and education, and the shift shows up in all of them
View original postPhoto by @patel.aminata· Nov 5, 2026· Photo 1 of 2· The New York Times
This image is a data visualization chart breaking down 2024 election voting preferences by gender and race. The chart displays percentages for Democratic and Republican support alongside margins like D+17 and D+13, with blue highlighting for Democratic-leaning groups and red for Republican-leaning ones. It shows voter composition stats such as males at 47% of voters and whites at 70%. The style is a clean, straightforward news graphic with bold blue and red color coding for the two parties.
See all The New York Times photosRead the The New York Times wiki
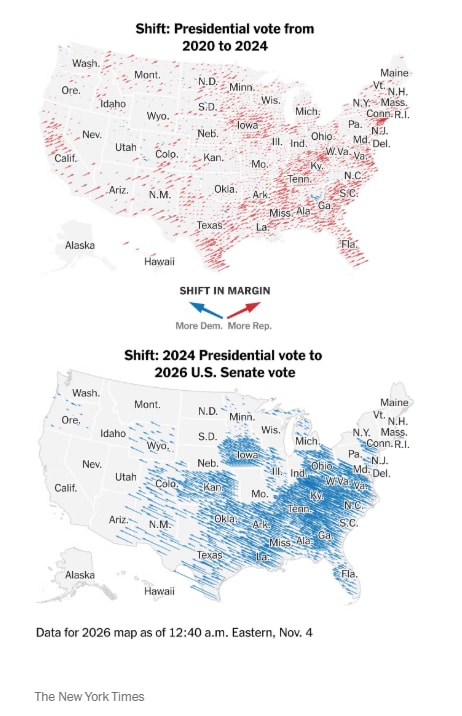 US election shifts 2024 to 2026
 Bukele denies NYT report on remains in Haiti
 2Britney Spears The Woman in Me memoir
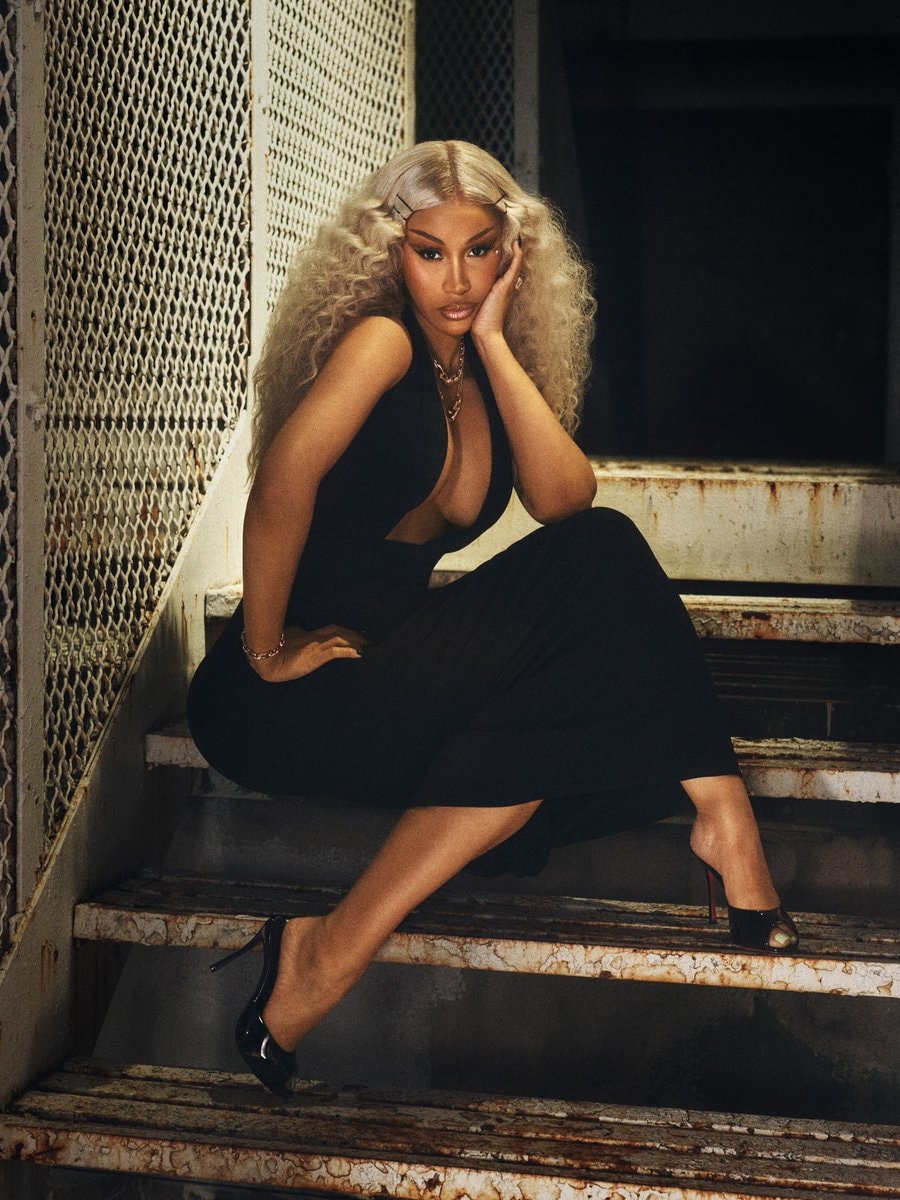 3Cardi B The Greats Issue 2026
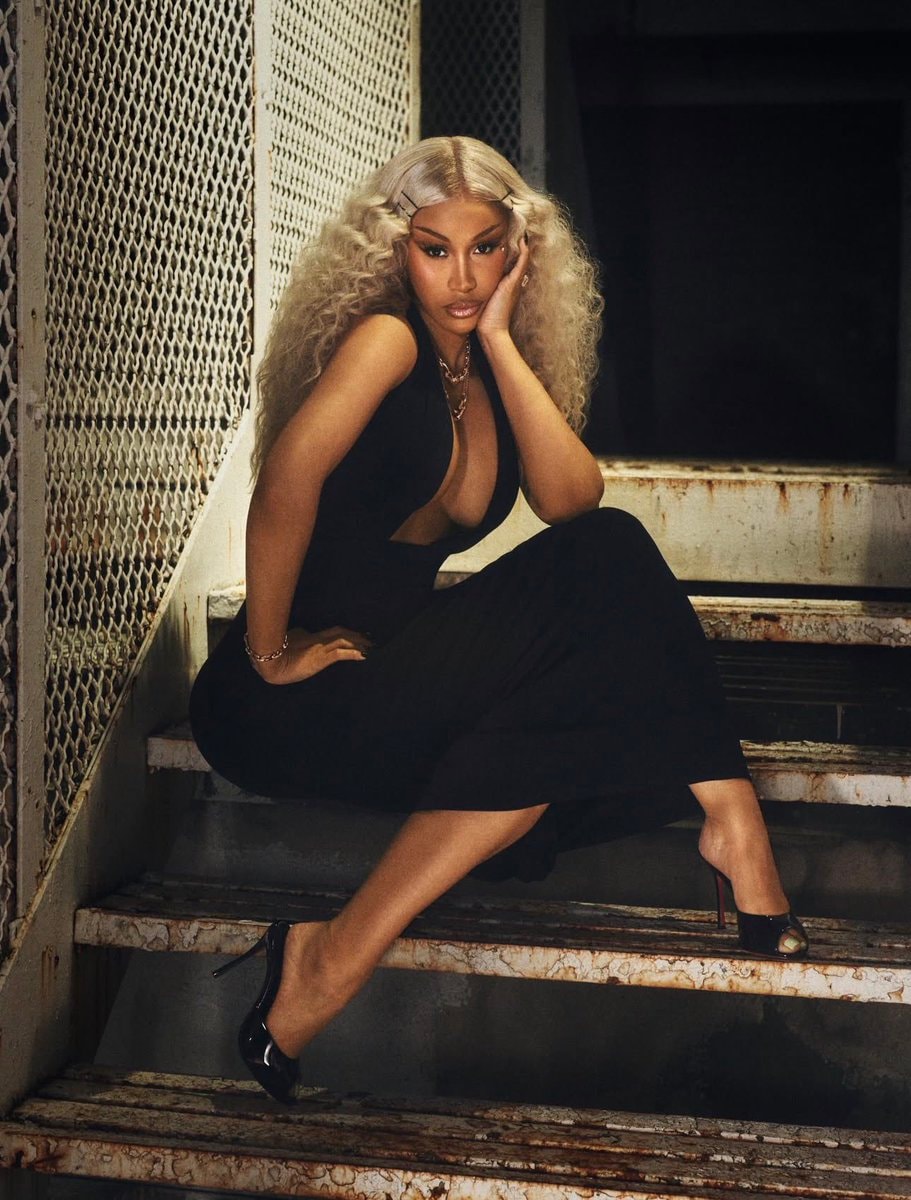 2Cardi B The Greats Issue 2026
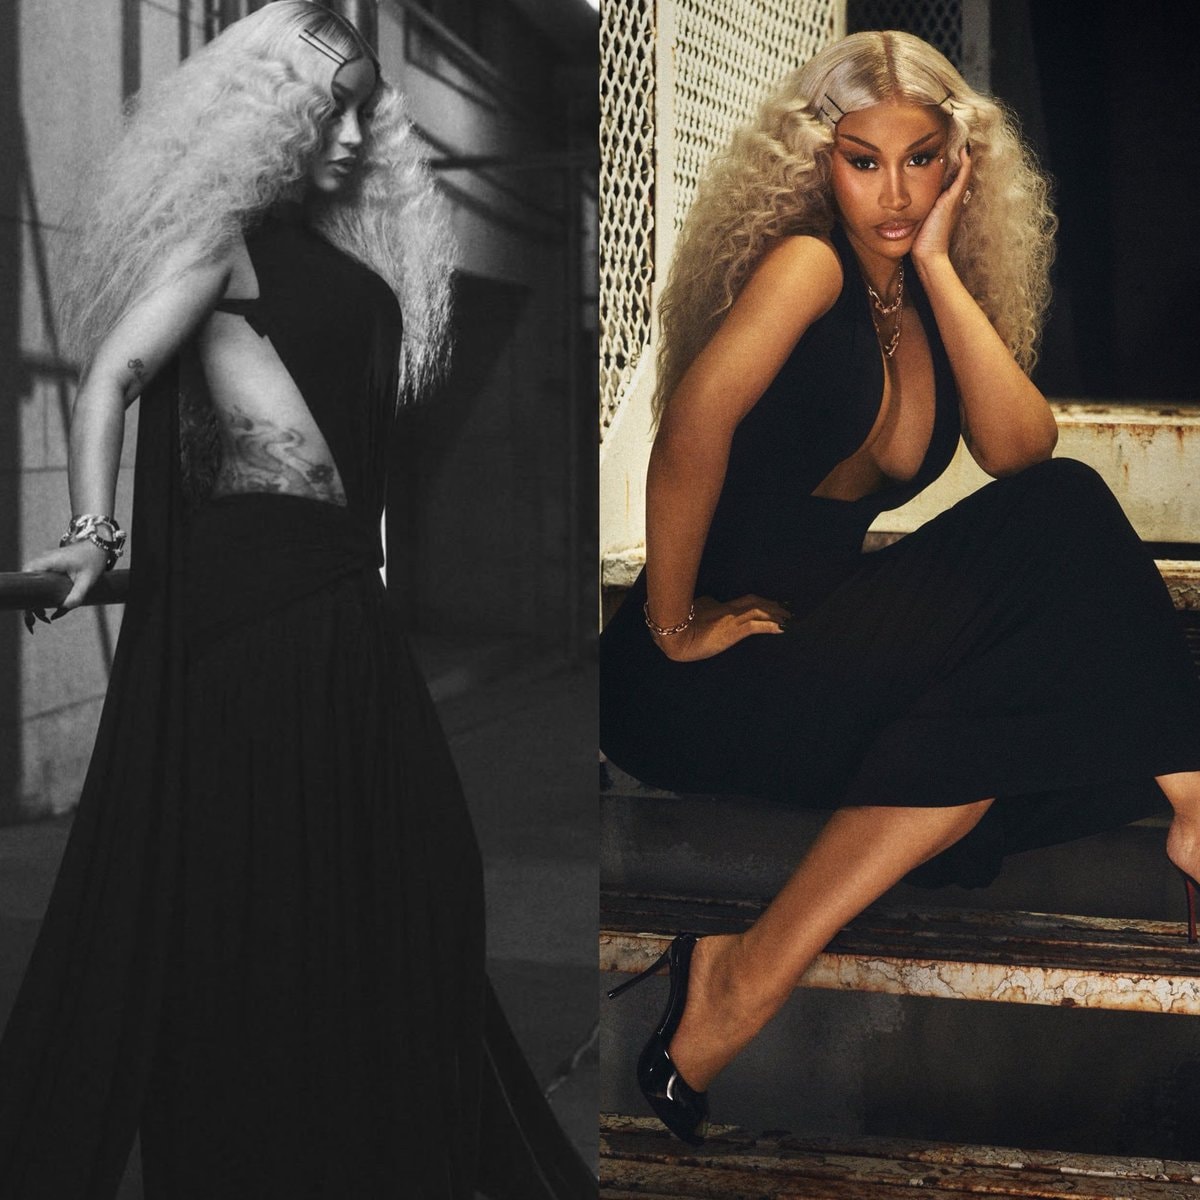 Cardi B The Greats Issue 2026
 A Sinner in Mecca Parvez Sharma documentary
 Katie Zacharia White House Press Secretary
 4Cornell disciplinary actions 2024
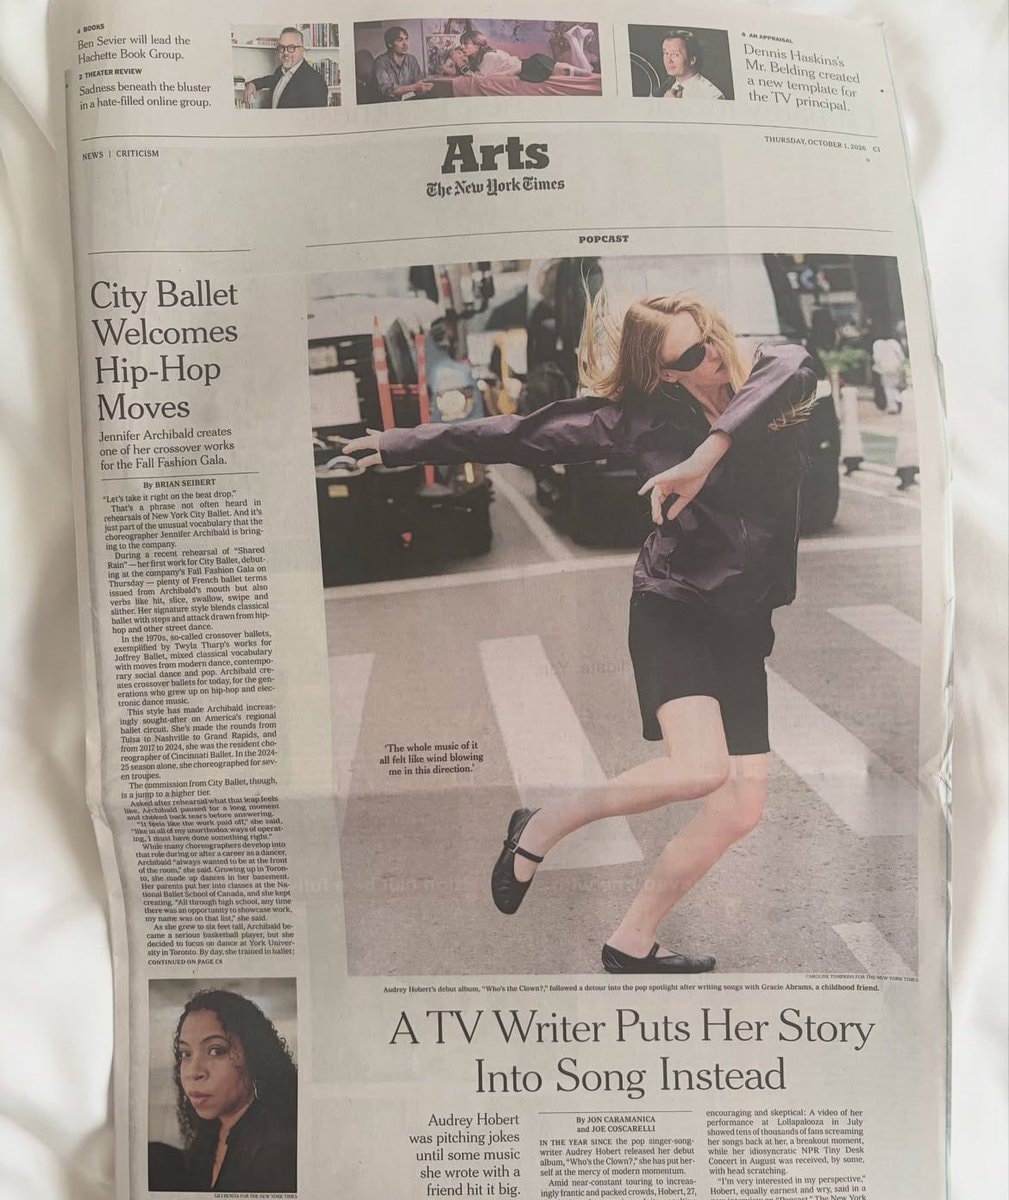 2Audrey Hobert New York Times Arts
 The New York Times Flydubai update
@patel.aminataEvery demographic group moved toward Democratic candidates in 2026 compared with 2024, per The New York Times. The paper's breakdown covers gender, race, age and education, and the shift shows up in all of them
View original postPhoto by @patel.aminata· Nov 5, 2026· Photo 1 of 2· The New York Times
This image is a data visualization chart breaking down 2024 election voting preferences by gender and race. The chart displays percentages for Democratic and Republican support alongside margins like D+17 and D+13, with blue highlighting for Democratic-leaning groups and red for Republican-leaning ones. It shows voter composition stats such as males at 47% of voters and whites at 70%. The style is a clean, straightforward news graphic with bold blue and red color coding for the two parties.
See all The New York Times photosRead the The New York Times wiki
US election shifts 2024 to 2026Bukele denies NYT report on remains in Haiti2Britney Spears The Woman in Me memoir3Cardi B The Greats Issue 20262Cardi B The Greats Issue 2026Cardi B The Greats Issue 2026A Sinner in Mecca Parvez Sharma documentaryKatie Zacharia White House Press Secretary4Cornell disciplinary actions 20242Audrey Hobert New York Times ArtsThe New York Times Flydubai update