About this photo
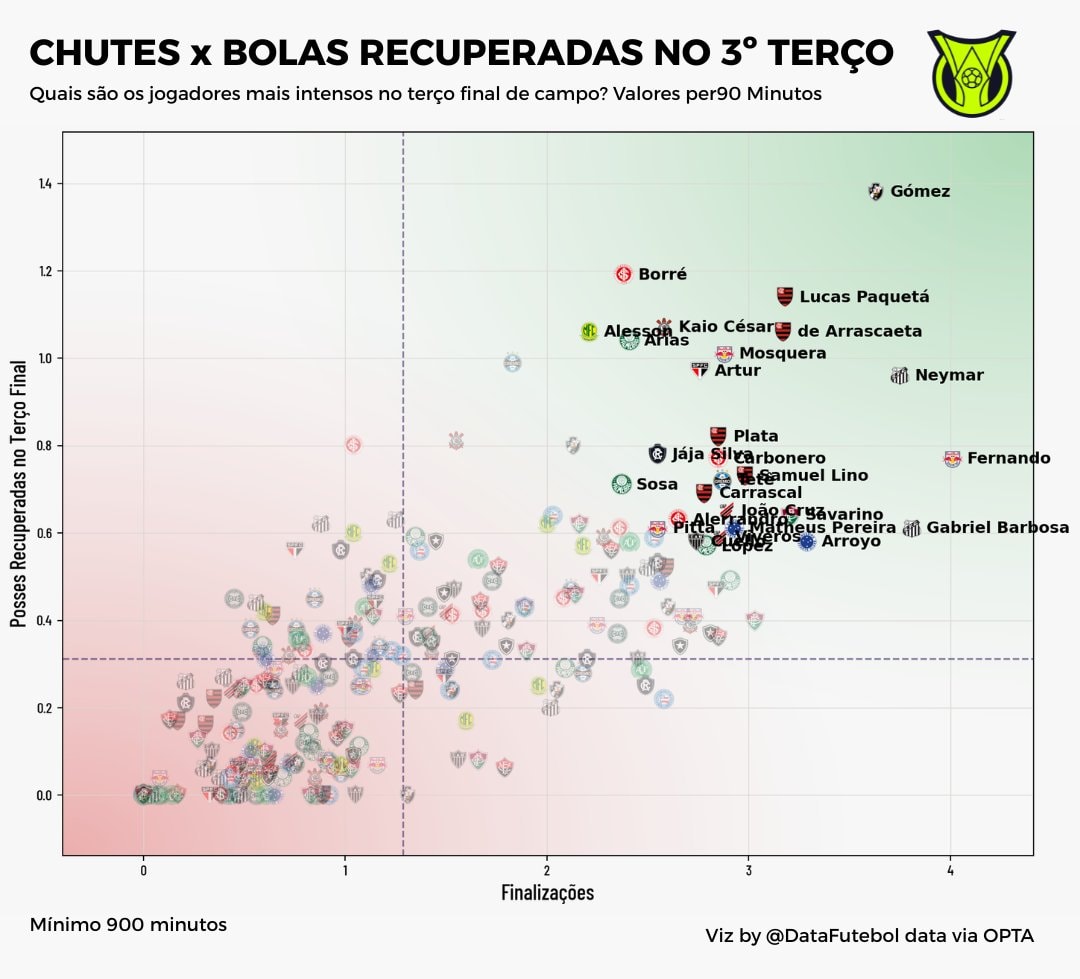
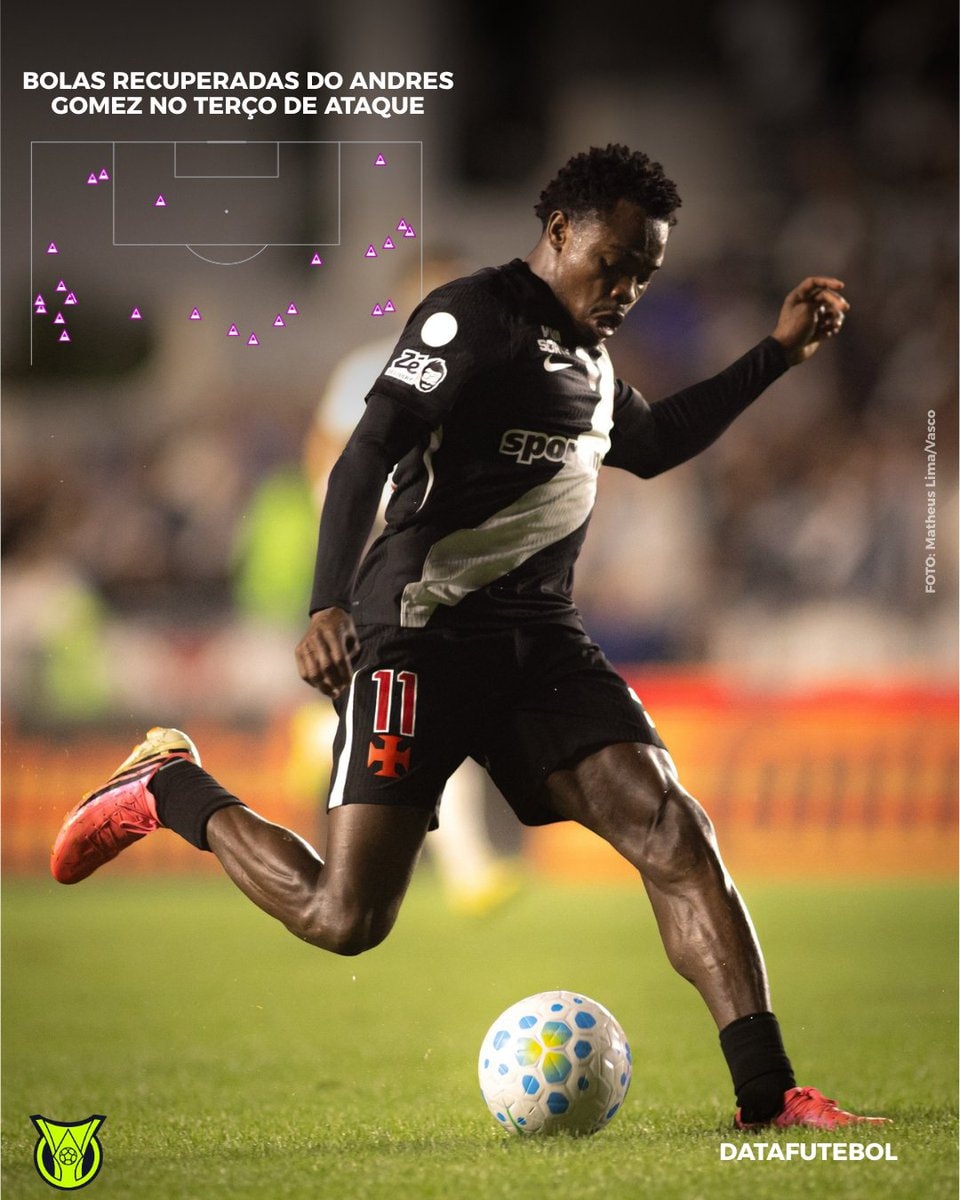
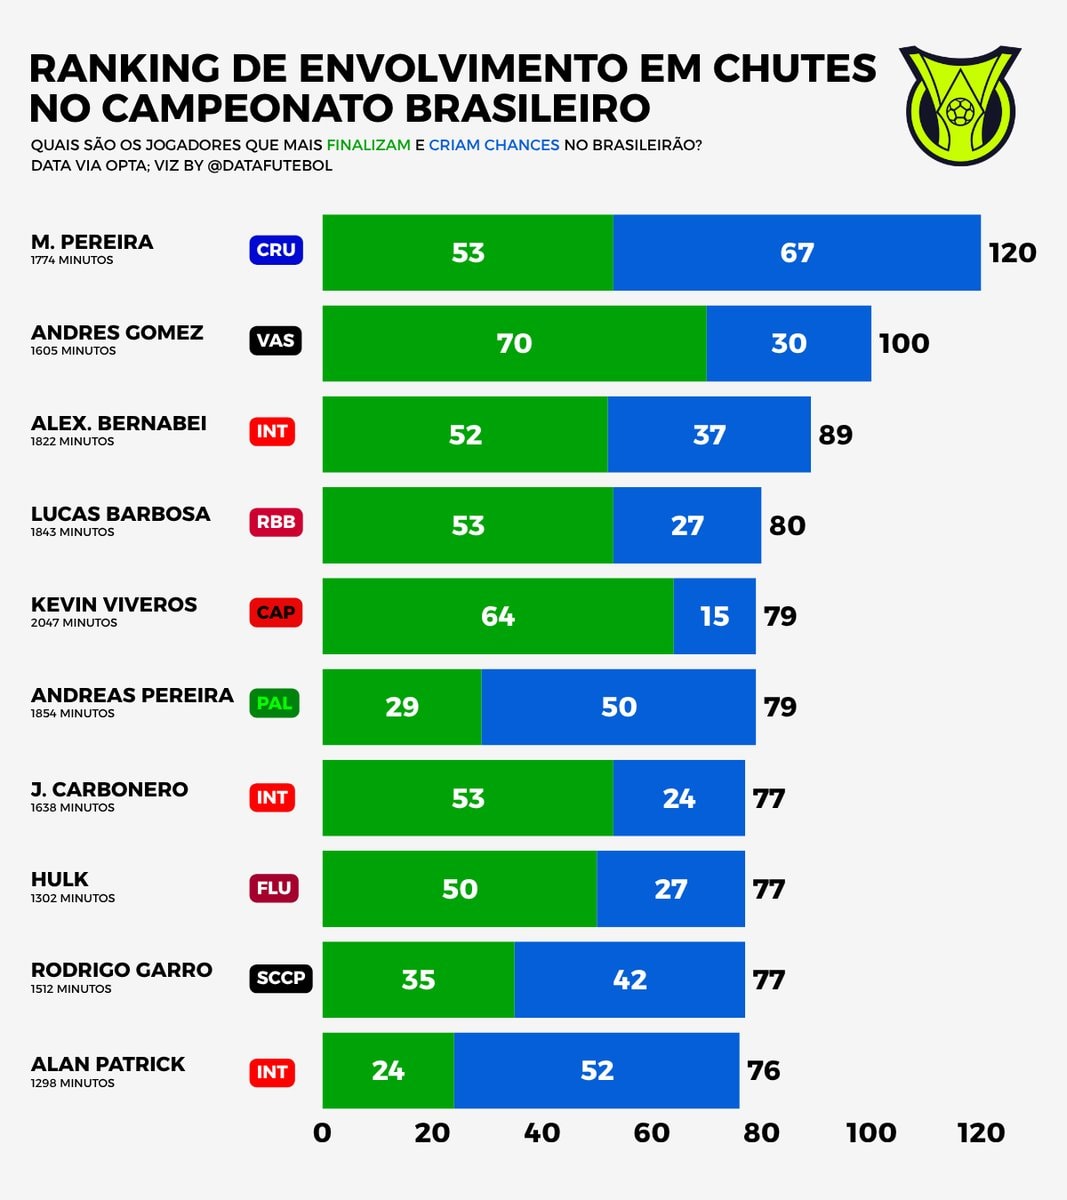
This is a scatter plot analyzing soccer players' performance in the final third of the field, showing shots versus recovered balls per 90 minutes. The plot is colorful with many small icons representing players, with some names like Gomez, Borre, Lucas Paquetá, and Neymar highlighted. The mood is analytical and data-driven, with a clean, infographic style. A notable detail is the Viz by @DataFutebol data via OPTA watermark at the bottom right. ON-SCREEN TEXT: CHUTES x BOLAS RECUPERADAS NO 3º TERÇO Quais são os jogadores mais intensos no terço final de campo? Valores per90 Minutos Mínimo 900 minutos Viz by @DataFutebol data via OPTA


No comments yet. Be the first!