
iFANN
    Search iFANN...
    Log in
    Home
    News
    Videos
    Photos
    GIFs
    Explore
    Polls
    Awards
    iFAMOUS
    Wiki
    Anime
    Rooms
    Notifications
    Messages
    Bookmarks
    Profile
    WikiAwardsiFAMOUSRankingsIndustriesCreator RewardsUser RewardsTermsPrivacyCommunity GuidelinesTakedown / DMCAHelpDevelopers

    ยฉ 2026 iFANN

    Home
    Search
    Messages
    Alerts
    Profile
    Photo
    Jolyon
    Jolyon@jolyon4h
    ๐ŸŒUnited States๐Ÿ’ญFinance๐Ÿ’ญNews
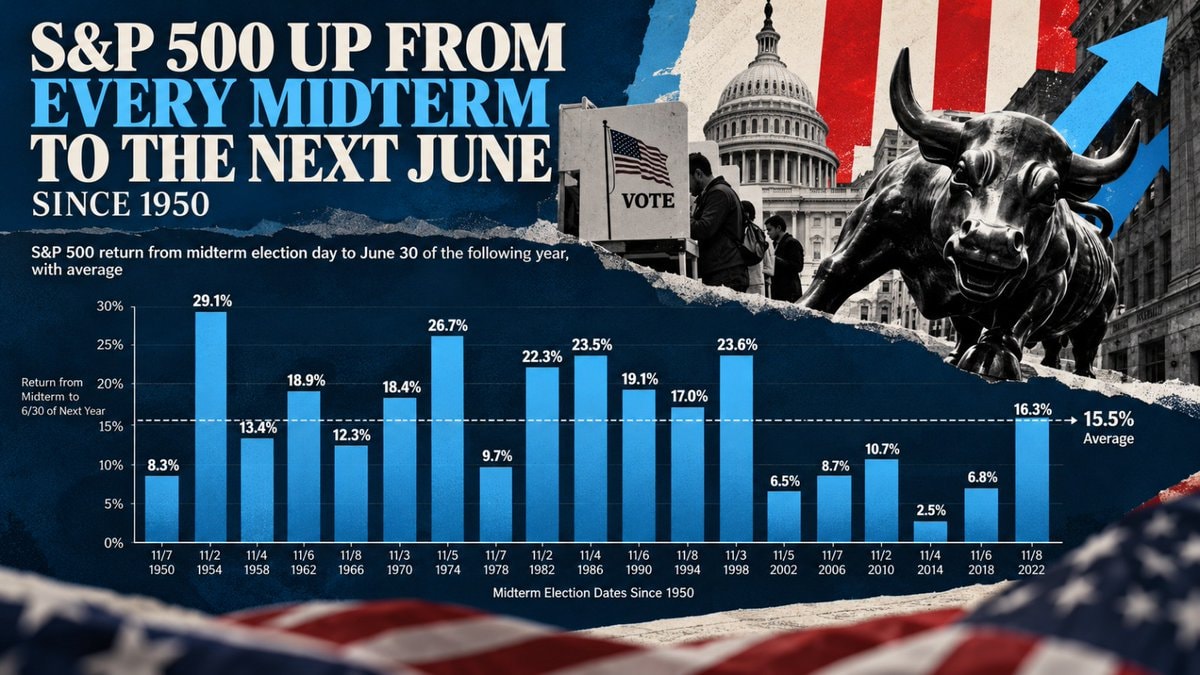
    S&P 500 midterm election gains since 1950

    @jolyonIt turns out the S&P 500 has never dipped between a U.S. midterm election and the following June since 1950. Every single instance analyzed resulted in positive returns, with the average gain sitting at 15.5% from Election Day through June 30 of the subsequent year. The rallies were sometimes massive, including a 29.1% jump after 1954, a 26.7% rise following 1970, and a 23.6% increase after 1994. There isn't a single period where the market failed to finish higher during that window. Data compiled by obermeyerwealth and written by Samuel confirms this consistent upward trend across all decades examined. #UnitedStates

    View original post
    S&P 500 midterm election gains since 1950

    Photo by @jolyonยท Oct 27, 2026ยท United States

    About this photo

    The image is a graphic displaying financial data. It features a bar chart showing the S&P 500 return from midterm election day to June 30 of the following year, with data points dating back to 1950. Dominating the background is a powerful image of the Charging Bull statue, with the US Capitol building and voting booths also visible. The overall mood is serious and informative, with a patriotic aesthetic suggested by the American flag elements. The text overlay reads: "S&P 500 UP FROM EVERY MIDTERM TO THE NEXT JUNE SINCE 1950".

    See all United States photos

    ?

    More United States photos

    See all United States photos
    Netanyahu bloc short in Israeli exit pollsNetanyahu bloc short in Israeli exit pollsmost expensive US toll roads mapmost expensive US toll roads mapCheerios Ziploc resealable bagCheerios Ziploc resealable bagErica Sayre Clifford Gale Sayre allegations2Erica Sayre Clifford Gale Sayre allegationsGerman police vomiting defense tacticGerman police vomiting defense tacticEU regulation change for AI training2EU regulation change for AI trainingXie Junwu wheelchair wheelie record2Xie Junwu wheelchair wheelie recordFRN defeat Tshisekedi army in South Kivu4FRN defeat Tshisekedi army in South KivuAndy Biggs Arizona election map2Andy Biggs Arizona election mapArea 51 reptilian claim from ex-Army sniper2Area 51 reptilian claim from ex-Army sniperAnthony Rivers III arrestAnthony Rivers III arrestChina party corruption crackdown2China party corruption crackdownNICU Halloween costumes US4NICU Halloween costumes USEuropean countries mapEuropean countries mapMojtaba Jamenei Iran supreme leader meetingMojtaba Jamenei Iran supreme leader meetingTrump era US gas prices2Trump era US gas pricesI'm single and searching ๐Ÿ˜”I'm single and searching ๐Ÿ˜”
    Photo
    Jolyon
    Jolyon@jolyon4h
    ๐ŸŒUnited States๐Ÿ’ญFinance๐Ÿ’ญNews
    S&P 500 midterm election gains since 1950

    @jolyonIt turns out the S&P 500 has never dipped between a U.S. midterm election and the following June since 1950. Every single instance analyzed resulted in positive returns, with the average gain sitting at 15.5% from Election Day through June 30 of the subsequent year. The rallies were sometimes massive, including a 29.1% jump after 1954, a 26.7% rise following 1970, and a 23.6% increase after 1994. There isn't a single period where the market failed to finish higher during that window. Data compiled by obermeyerwealth and written by Samuel confirms this consistent upward trend across all decades examined. #UnitedStates

    View original post

    S&P 500 midterm election gains since 1950

    Photo by @jolyonยท Oct 27, 2026ยท United States

    About this photo

    The image is a graphic displaying financial data. It features a bar chart showing the S&P 500 return from midterm election day to June 30 of the following year, with data points dating back to 1950. Dominating the background is a powerful image of the Charging Bull statue, with the US Capitol building and voting booths also visible. The overall mood is serious and informative, with a patriotic aesthetic suggested by the American flag elements. The text overlay reads: "S&P 500 UP FROM EVERY MIDTERM TO THE NEXT JUNE SINCE 1950".

    See all United States photos

    ?

    More United States photos

    See all United States photos
    Netanyahu bloc short in Israeli exit pollsNetanyahu bloc short in Israeli exit pollsmost expensive US toll roads mapmost expensive US toll roads mapCheerios Ziploc resealable bagCheerios Ziploc resealable bagErica Sayre Clifford Gale Sayre allegations2Erica Sayre Clifford Gale Sayre allegationsGerman police vomiting defense tacticGerman police vomiting defense tacticEU regulation change for AI training2EU regulation change for AI trainingXie Junwu wheelchair wheelie record2Xie Junwu wheelchair wheelie recordFRN defeat Tshisekedi army in South Kivu4FRN defeat Tshisekedi army in South KivuAndy Biggs Arizona election map2Andy Biggs Arizona election mapArea 51 reptilian claim from ex-Army sniper2Area 51 reptilian claim from ex-Army sniperAnthony Rivers III arrestAnthony Rivers III arrestChina party corruption crackdown2China party corruption crackdownNICU Halloween costumes US4NICU Halloween costumes USEuropean countries mapEuropean countries mapMojtaba Jamenei Iran supreme leader meetingMojtaba Jamenei Iran supreme leader meetingTrump era US gas prices2Trump era US gas pricesI'm single and searching ๐Ÿ˜”I'm single and searching ๐Ÿ˜”