iFANN
    Search iFANN...
    Log in
    Home
    News
    Videos
    Photos
    GIFs
    Explore
    Polls
    Awards
    iFAMOUS
    Wiki
    Anime
    Rooms
    Notifications
    Messages
    Bookmarks
    Profile
    WikiAwardsiFAMOUSRankingsIndustriesCreator RewardsUser RewardsTermsPrivacyCommunity GuidelinesTakedown / DMCAHelpDevelopers

    ยฉ 2026 iFANN

    Home
    Search
    Messages
    Alerts
    Profile
    Photo
    Not A Newt
    Not A Newt@not_a_newt14h
    ๐ŸขMicrosoft๐Ÿ’ญTech๐Ÿ’ญartificial intelligence
    Microsoft revenue vs headcount AI

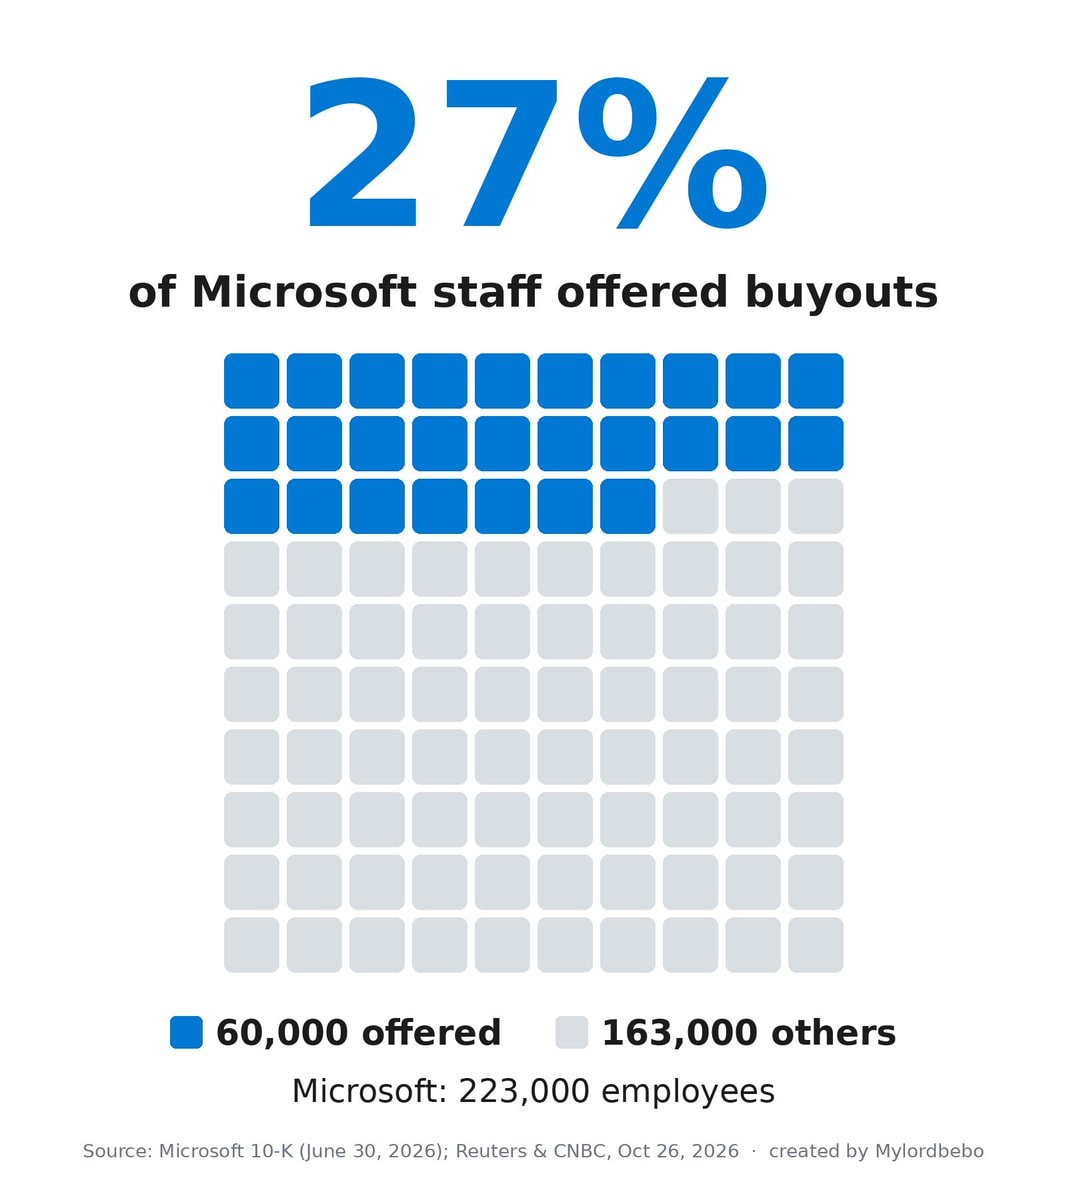
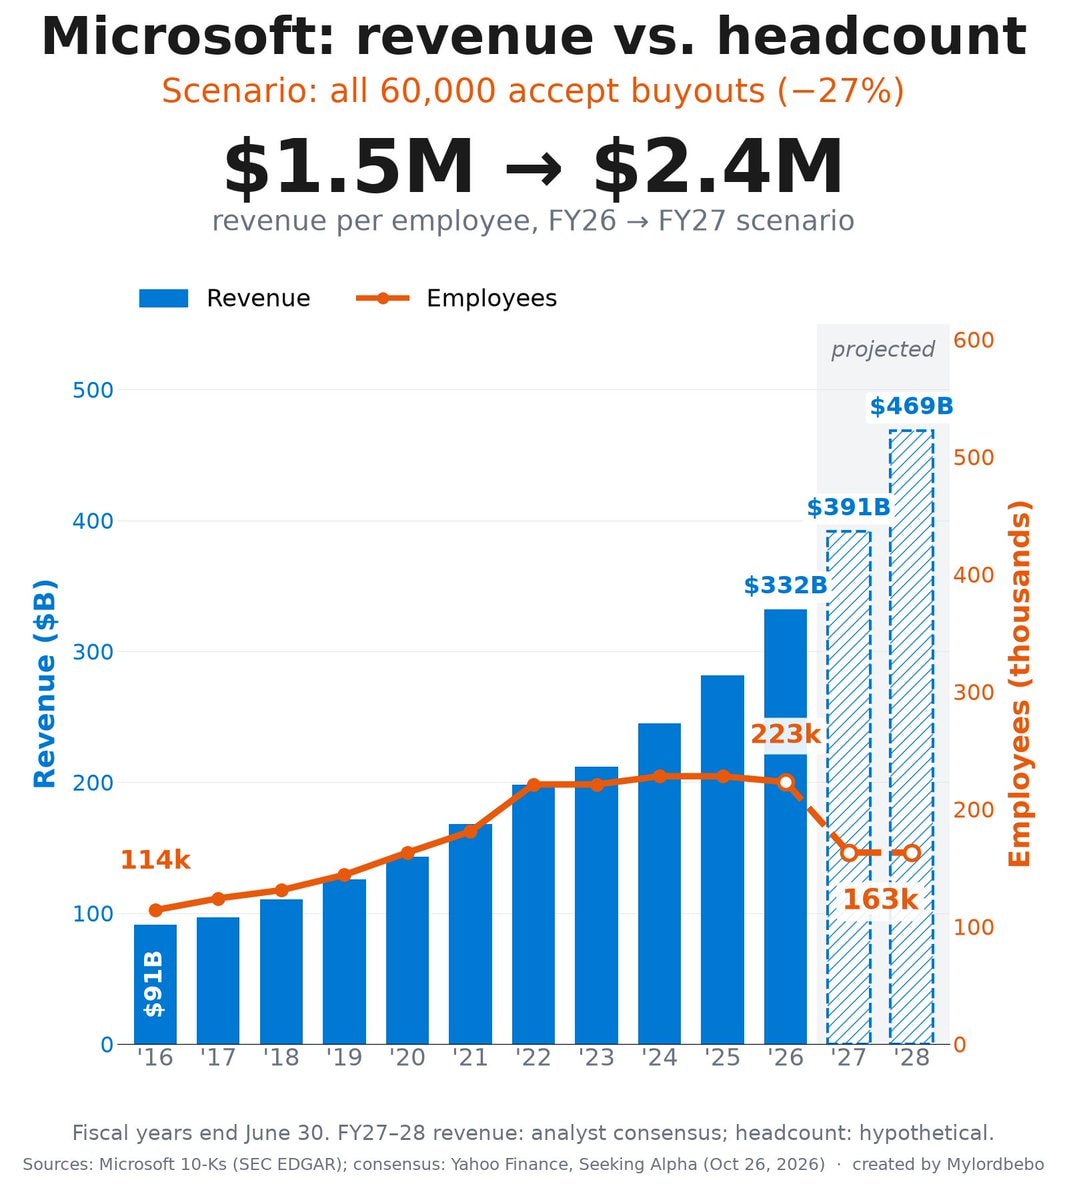
    @not_a_newtthe argument that Microsoft over-hired doesn't really hold up. before, revenue growth always came with more employees, so headcount was a decent proxy for how the business was doing. since roughly 2024 that link has broken: revenue and headcount no longer move together. all the AI tools mean fewer people are needed, which is why companies can scale revenue while cutting headcount. fewer people to manage, fewer to talk to customers, fewer to write reports, and so on. we'll see more of that.

    View original post


    Microsoft revenue vs headcount AI

    Photo by @not_a_newtยท Oct 26, 2026ยท Microsoft

    About this photo

    The image is a bar and line graph showing Microsoft's revenue versus headcount. Blue bars represent revenue in billions of dollars, and an orange line represents employees in thousands. The graph shows historical data from fiscal year '16 to '26, with projected data for '27 and '28. The mood is informative and analytical, presented in a clean, data-driven style. A notable detail is the projected decrease in employees from '26 to '27, indicated by a dashed line and a downward trend. ON-SCREEN TEXT: Microsoft: revenue vs. headcount Scenario: all 60,000 accept buyouts (-27%) $1.5M โ†’ $2.4M revenue per employee, FY26 โ†’ FY27 scenario Revenue Employees projected $469B $391B $332B 223k 163k 114k $91B '16 '17 '18 '1

    See all Microsoft photosRead the Microsoft wiki

    ?

    No comments yet. Be the first!

    More Microsoft photos

    See all Microsoft photos
    AIPOCH Open-Science AI electricity studyAIPOCH Open-Science AI electricity studyAnthropic IPO filing $ANT2Anthropic IPO filing $ANTLingguang muse positioningLingguang muse positioningClaude denies $1M MRR B2B SaaS promptClaude denies $1M MRR B2B SaaS promptiPhone Duo hinge cracking complaintsiPhone Duo hinge cracking complaintsMicrosoft 27% workforce cutMicrosoft 27% workforce cutJulian Figueroa live on ownership and subscriptionsJulian Figueroa live on ownership and subscriptionsUnitree robots 80% household chores by 20282Unitree robots 80% household chores by 2028iPhone Duo screen breaks after few folds2iPhone Duo screen breaks after few foldsGermany fusion reactor 20402Germany fusion reactor 2040Nikola Tesla quote on power and mindsNikola Tesla quote on power and mindsXbox Game Pass free for T-Mobile customersXbox Game Pass free for T-Mobile customersClaude Duet money desks promptClaude Duet money desks promptFNB mobile banking outage reportsFNB mobile banking outage reportsHarley Morenstein Twitter privateHarley Morenstein Twitter privateWindows XP launch anniversary2Windows XP launch anniversary
    Photo
    Not A Newt
    Not A Newt@not_a_newt14h
    ๐ŸขMicrosoft๐Ÿ’ญTech๐Ÿ’ญartificial intelligence
    Microsoft revenue vs headcount AI

    @not_a_newtthe argument that Microsoft over-hired doesn't really hold up. before, revenue growth always came with more employees, so headcount was a decent proxy for how the business was doing. since roughly 2024 that link has broken: revenue and headcount no longer move together. all the AI tools mean fewer people are needed, which is why companies can scale revenue while cutting headcount. fewer people to manage, fewer to talk to customers, fewer to write reports, and so on. we'll see more of that.

    View original post

    Microsoft revenue vs headcount AI

    Photo by @not_a_newtยท Oct 26, 2026ยท Microsoft

    About this photo

    The image is a bar and line graph showing Microsoft's revenue versus headcount. Blue bars represent revenue in billions of dollars, and an orange line represents employees in thousands. The graph shows historical data from fiscal year '16 to '26, with projected data for '27 and '28. The mood is informative and analytical, presented in a clean, data-driven style. A notable detail is the projected decrease in employees from '26 to '27, indicated by a dashed line and a downward trend. ON-SCREEN TEXT: Microsoft: revenue vs. headcount Scenario: all 60,000 accept buyouts (-27%) $1.5M โ†’ $2.4M revenue per employee, FY26 โ†’ FY27 scenario Revenue Employees projected $469B $391B $332B 223k 163k 114k $91B '16 '17 '18 '1

    See all Microsoft photosRead the Microsoft wiki

    ?

    No comments yet. Be the first!

    More Microsoft photos

    See all Microsoft photos
    AIPOCH Open-Science AI electricity studyAIPOCH Open-Science AI electricity studyAnthropic IPO filing $ANT2Anthropic IPO filing $ANTLingguang muse positioningLingguang muse positioningClaude denies $1M MRR B2B SaaS promptClaude denies $1M MRR B2B SaaS promptiPhone Duo hinge cracking complaintsiPhone Duo hinge cracking complaintsMicrosoft 27% workforce cutMicrosoft 27% workforce cutJulian Figueroa live on ownership and subscriptionsJulian Figueroa live on ownership and subscriptionsUnitree robots 80% household chores by 20282Unitree robots 80% household chores by 2028iPhone Duo screen breaks after few folds2iPhone Duo screen breaks after few foldsGermany fusion reactor 20402Germany fusion reactor 2040Nikola Tesla quote on power and mindsNikola Tesla quote on power and mindsXbox Game Pass free for T-Mobile customersXbox Game Pass free for T-Mobile customersClaude Duet money desks promptClaude Duet money desks promptFNB mobile banking outage reportsFNB mobile banking outage reportsHarley Morenstein Twitter privateHarley Morenstein Twitter privateWindows XP launch anniversary2Windows XP launch anniversary