iFANN
    Search iFANN...
    Log in
    Home
    News
    Videos
    Photos
    GIFs
    Explore
    Polls
    Awards
    iFAMOUS
    Wiki
    Anime
    Rooms
    Notifications
    Messages
    Bookmarks
    Profile
    WikiAwardsiFAMOUSRankingsIndustriesCreator RewardsUser RewardsTermsPrivacyCommunity GuidelinesTakedown / DMCAHelpDevelopers

    ยฉ 2026 iFANN

    Home
    Search
    Messages
    Alerts
    Profile
    Photo
    Not A Newt
    Not A Newt@not_a_newt1h
    ๐ŸขMicrosoft๐Ÿ’ญTech๐Ÿ’ญartificial intelligence
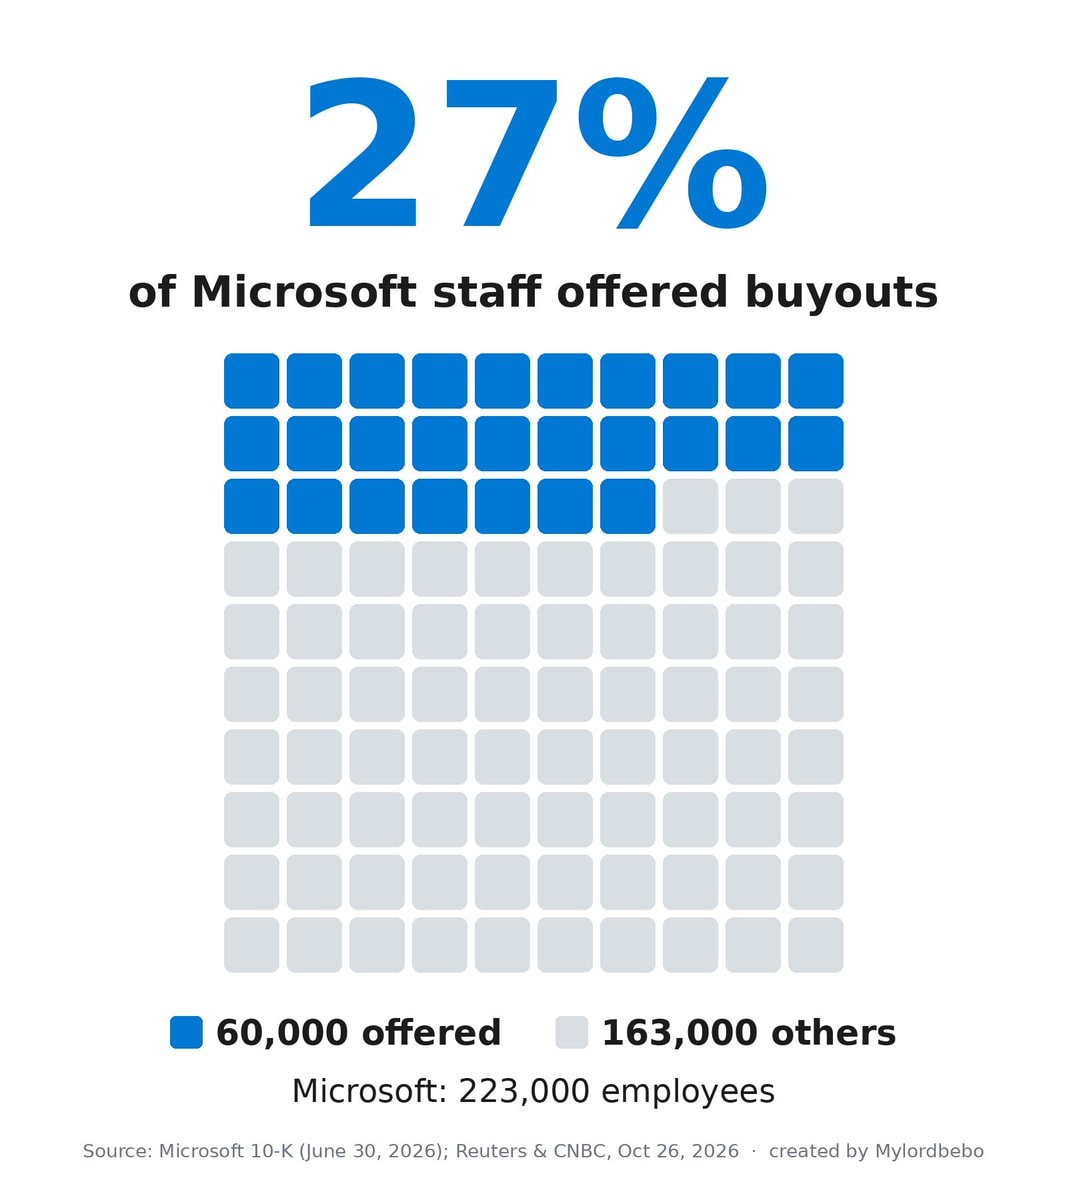
    Microsoft revenue vs headcount AI

    @not_a_newtthe argument that Microsoft over-hired doesn't really hold up. before, revenue growth always came with more employees, so headcount was a decent proxy for how the business was doing. since roughly 2024 that link has broken: revenue and headcount no longer move together. all the AI tools mean fewer people are needed, which is why companies can scale revenue while cutting headcount. fewer people to manage, fewer to talk to customers, fewer to write reports, and so on. we'll see more of that.

    View original post
    Microsoft revenue vs headcount AI

    Photo by @not_a_newtยท Oct 26, 2026ยท Microsoft

    About this photo

    The image is a bar and line graph showing Microsoft's revenue versus headcount. Blue bars represent revenue in billions of dollars, and an orange line represents employees in thousands. The graph shows historical data from fiscal year '16 to '26, with projected data for '27 and '28. The mood is informative and analytical, presented in a clean, data-driven style. A notable detail is the projected decrease in employees from '26 to '27, indicated by a dashed line and a downward trend. ON-SCREEN TEXT: Microsoft: revenue vs. headcount Scenario: all 60,000 accept buyouts (-27%) $1.5M โ†’ $2.4M revenue per employee, FY26 โ†’ FY27 scenario Revenue Employees projected $469B $391B $332B 223k 163k 114k $91B '16 '17 '18 '1

    See all Microsoft photosRead the Microsoft wiki

    ?

    No comments yet. Be the first!

    More Microsoft photos

    See all Microsoft photos
    Microsoft 27% workforce cutMicrosoft 27% workforce cutWindows XP launch anniversary2Windows XP launch anniversaryHow long it took to reach a $1 trillion market capHow long it took to reach a $1 trillion market capGears of War: E-Day reported $500M costGears of War: E-Day reported $500M costXbox next console release 2028Xbox next console release 2028Big Walk not on XboxBig Walk not on XboxBrad Smith on AI regulation2Brad Smith on AI regulationTrump administration tech sponsorship suspension2Trump administration tech sponsorship suspensionGTA 6 Xbox Cloud StreamingGTA 6 Xbox Cloud Streaminghand-drawn infographic on lined notebook paper2hand-drawn infographic on lined notebook paperAsha Sharma on Xbox future2Asha Sharma on Xbox futureWorld's biggest companies profit per $100 revenueWorld's biggest companies profit per $100 revenueMicrosoft execs admit to doom loop2Microsoft execs admit to doom loopMicrosoft game ad patentMicrosoft game ad patentNinja Theory closure and Senua cancellationNinja Theory closure and Senua cancellationXbox layoffs reportXbox layoffs reportXbox gaming ads patent2Xbox gaming ads patentmost valuable assets by market cap september 2026most valuable assets by market cap september 2026
    Photo
    Not A Newt
    Not A Newt@not_a_newt1h
    ๐ŸขMicrosoft๐Ÿ’ญTech๐Ÿ’ญartificial intelligence
    Microsoft revenue vs headcount AI

    @not_a_newtthe argument that Microsoft over-hired doesn't really hold up. before, revenue growth always came with more employees, so headcount was a decent proxy for how the business was doing. since roughly 2024 that link has broken: revenue and headcount no longer move together. all the AI tools mean fewer people are needed, which is why companies can scale revenue while cutting headcount. fewer people to manage, fewer to talk to customers, fewer to write reports, and so on. we'll see more of that.

    View original post

    Microsoft revenue vs headcount AI

    Photo by @not_a_newtยท Oct 26, 2026ยท Microsoft

    About this photo

    The image is a bar and line graph showing Microsoft's revenue versus headcount. Blue bars represent revenue in billions of dollars, and an orange line represents employees in thousands. The graph shows historical data from fiscal year '16 to '26, with projected data for '27 and '28. The mood is informative and analytical, presented in a clean, data-driven style. A notable detail is the projected decrease in employees from '26 to '27, indicated by a dashed line and a downward trend. ON-SCREEN TEXT: Microsoft: revenue vs. headcount Scenario: all 60,000 accept buyouts (-27%) $1.5M โ†’ $2.4M revenue per employee, FY26 โ†’ FY27 scenario Revenue Employees projected $469B $391B $332B 223k 163k 114k $91B '16 '17 '18 '1

    See all Microsoft photosRead the Microsoft wiki

    ?

    No comments yet. Be the first!

    More Microsoft photos

    See all Microsoft photos
    Microsoft 27% workforce cutMicrosoft 27% workforce cutWindows XP launch anniversary2Windows XP launch anniversaryHow long it took to reach a $1 trillion market capHow long it took to reach a $1 trillion market capGears of War: E-Day reported $500M costGears of War: E-Day reported $500M costXbox next console release 2028Xbox next console release 2028Big Walk not on XboxBig Walk not on XboxBrad Smith on AI regulation2Brad Smith on AI regulationTrump administration tech sponsorship suspension2Trump administration tech sponsorship suspensionGTA 6 Xbox Cloud StreamingGTA 6 Xbox Cloud Streaminghand-drawn infographic on lined notebook paper2hand-drawn infographic on lined notebook paperAsha Sharma on Xbox future2Asha Sharma on Xbox futureWorld's biggest companies profit per $100 revenueWorld's biggest companies profit per $100 revenueMicrosoft execs admit to doom loop2Microsoft execs admit to doom loopMicrosoft game ad patentMicrosoft game ad patentNinja Theory closure and Senua cancellationNinja Theory closure and Senua cancellationXbox layoffs reportXbox layoffs reportXbox gaming ads patent2Xbox gaming ads patentmost valuable assets by market cap september 2026most valuable assets by market cap september 2026