iFANN
    Search iFANN...
    Log in
    Home
    News
    Videos
    Photos
    GIFs
    Explore
    Polls
    Awards
    iFAMOUS
    Wiki
    Anime
    Rooms
    Notifications
    Messages
    Bookmarks
    Profile
    WikiAwardsiFAMOUSRankingsIndustriesCreator RewardsUser RewardsTermsPrivacyCommunity GuidelinesTakedown / DMCAHelpDevelopers

    © 2026 iFANN

    Home
    Search
    Messages
    Alerts
    Profile
    Photo
    Not A Newt
    Not A Newt@not_a_newt1h
    💭Viral News💭Finance
    Europe deindustrialization in energy numbers

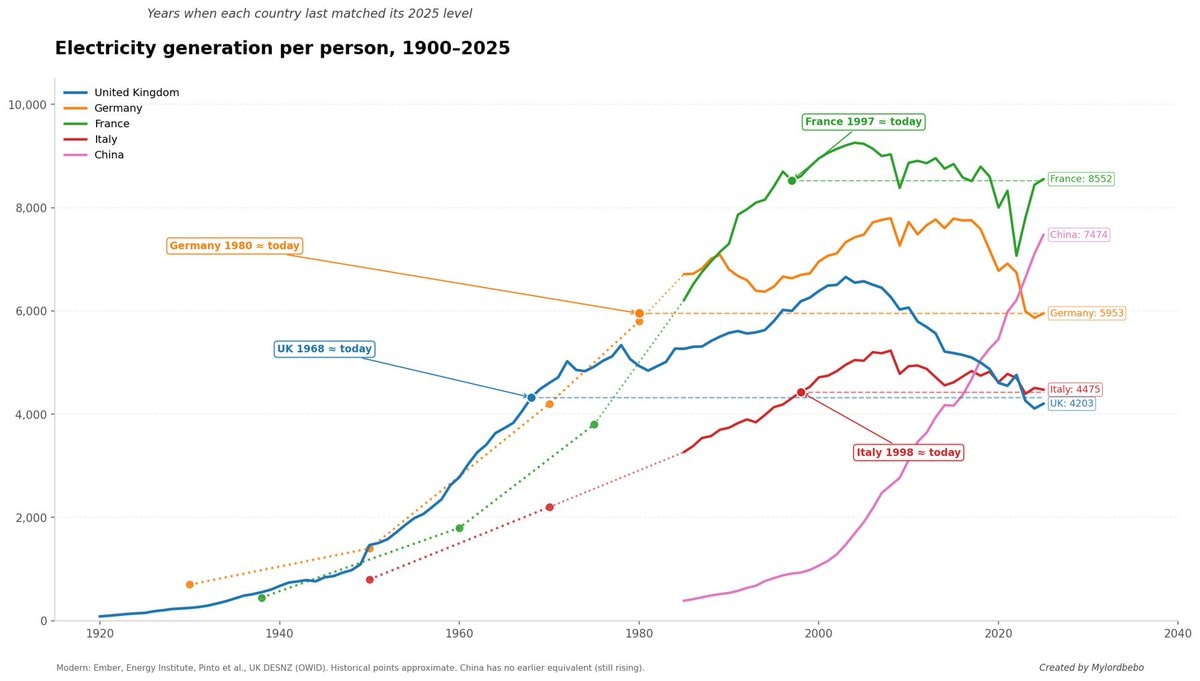
    @not_a_newtchina is climbing fast and europe's industrial edge over it keeps slipping, that's the part that lands. the per capita energy numbers make the case: the united kingdom sits at its 1968 level and germany at its 1980 level, both presented as today. france and italy are on the same chart, same direction. call it deindustrialization or call it backward development, either way the trajectory is down while china goes up. and the reminder underneath it all: no wealthy nation runs on low energy. production per capita and wealth move together, so a continent losing the first is losing the second.

    View original post


    Europe deindustrialization in energy numbers

    Photo by @not_a_newt· Oct 25, 2026· Viral News

    About this photo

    This is a line graph showing electricity generation per person from 1900 to 2025 for the United Kingdom, Germany, France, Italy, and China. The graph displays trends over time with different colored lines representing each country. Notable annotations include "Germany 1980 ≈ today", "UK 1968 ≈ today", "France 1997 ≈ today", and specific values for France, China, Germany, Italy, and the UK. The style is informational and data-driven, with a watermark "Created by My lordbebo" in the bottom right corner.

    See all Viral News photos

    ?

    More Viral News photos

    See all Viral News photos
    San Juan County New Mexico flooding rescuesSan Juan County New Mexico flooding rescuesElon Musk CNN investmentElon Musk CNN investmentGold toilet war money warningGold toilet war money warningDonald Trump Atlantic Ocean renameDonald Trump Atlantic Ocean renameSt. Marys Georgia police hazardous packageSt. Marys Georgia police hazardous packageShamonda virus France first caseShamonda virus France first caseLuisa González detention EcuadorLuisa González detention EcuadorUniversity of Utah campus alertUniversity of Utah campus alertGermany state media mandate on XGermany state media mandate on XToledo Ohio chemical leak2Toledo Ohio chemical leakMoroccan citizens asylum applications Ceuta SpainMoroccan citizens asylum applications Ceuta SpainHusband returns wife's stolen clothes to storeHusband returns wife's stolen clothes to storeParis Curfew AnnouncementParis Curfew AnnouncementRaúl Castro arrest warrant FloridaRaúl Castro arrest warrant FloridaGerman unemployment agency statsGerman unemployment agency statssingle mother home outcomes chartsingle mother home outcomes chart
    Photo
    Not A Newt
    Not A Newt@not_a_newt1h
    💭Viral News💭Finance
    Europe deindustrialization in energy numbers

    @not_a_newtchina is climbing fast and europe's industrial edge over it keeps slipping, that's the part that lands. the per capita energy numbers make the case: the united kingdom sits at its 1968 level and germany at its 1980 level, both presented as today. france and italy are on the same chart, same direction. call it deindustrialization or call it backward development, either way the trajectory is down while china goes up. and the reminder underneath it all: no wealthy nation runs on low energy. production per capita and wealth move together, so a continent losing the first is losing the second.

    View original post

    Europe deindustrialization in energy numbers

    Photo by @not_a_newt· Oct 25, 2026· Viral News

    About this photo

    This is a line graph showing electricity generation per person from 1900 to 2025 for the United Kingdom, Germany, France, Italy, and China. The graph displays trends over time with different colored lines representing each country. Notable annotations include "Germany 1980 ≈ today", "UK 1968 ≈ today", "France 1997 ≈ today", and specific values for France, China, Germany, Italy, and the UK. The style is informational and data-driven, with a watermark "Created by My lordbebo" in the bottom right corner.

    See all Viral News photos

    ?

    More Viral News photos

    See all Viral News photos
    San Juan County New Mexico flooding rescuesSan Juan County New Mexico flooding rescuesElon Musk CNN investmentElon Musk CNN investmentGold toilet war money warningGold toilet war money warningDonald Trump Atlantic Ocean renameDonald Trump Atlantic Ocean renameSt. Marys Georgia police hazardous packageSt. Marys Georgia police hazardous packageShamonda virus France first caseShamonda virus France first caseLuisa González detention EcuadorLuisa González detention EcuadorUniversity of Utah campus alertUniversity of Utah campus alertGermany state media mandate on XGermany state media mandate on XToledo Ohio chemical leak2Toledo Ohio chemical leakMoroccan citizens asylum applications Ceuta SpainMoroccan citizens asylum applications Ceuta SpainHusband returns wife's stolen clothes to storeHusband returns wife's stolen clothes to storeParis Curfew AnnouncementParis Curfew AnnouncementRaúl Castro arrest warrant FloridaRaúl Castro arrest warrant FloridaGerman unemployment agency statsGerman unemployment agency statssingle mother home outcomes chartsingle mother home outcomes chart