
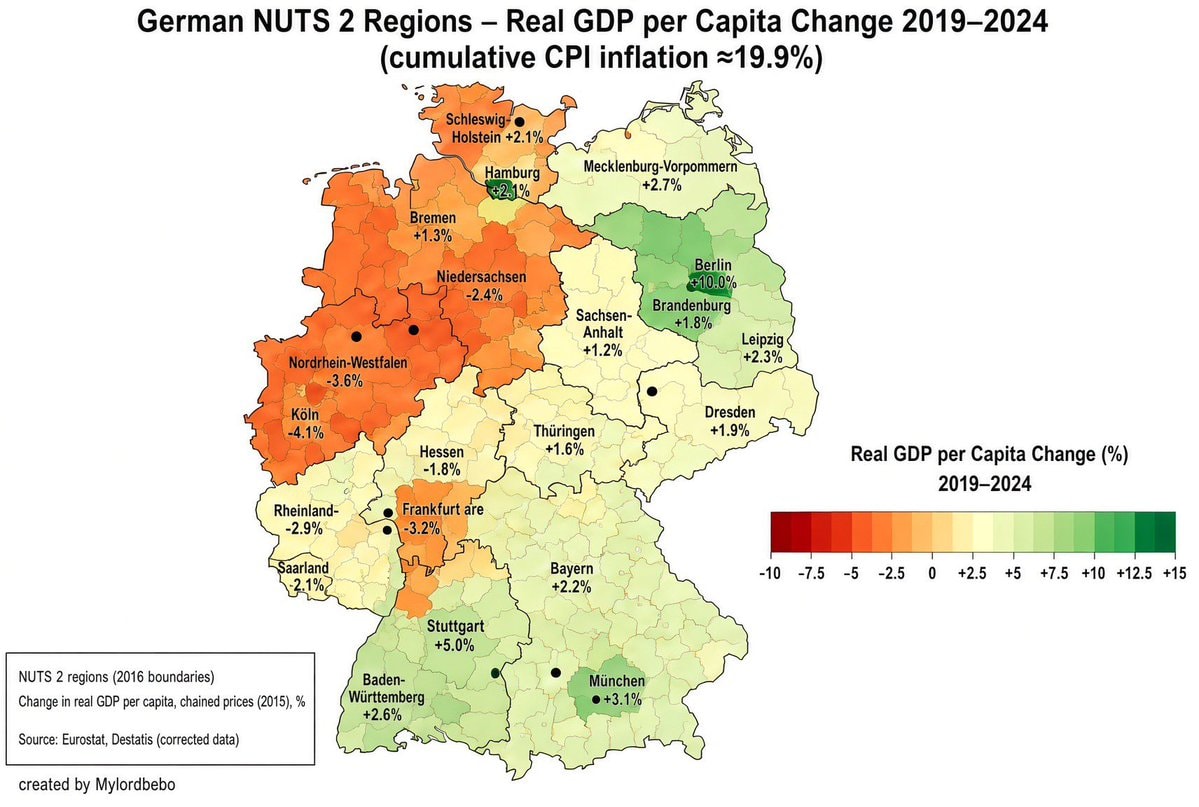
@not_a_newtthe industrial parts of germany are slowly drying out while the money pools in the big cities. that's a deindustrialization pattern showing up in german GDP, not just a rough patch.
View original post@not_a_newtthe industrial parts of germany are slowly drying out while the money pools in the big cities. that's a deindustrialization pattern showing up in german GDP, not just a rough patch.
View original postPhoto by @not_a_newt· Oct 23, 2026· Germany
The image is a map of Germany divided into NUTS 2 regions. The map shows the real GDP per capita change from 2019-2024, with regions colored according to their percentage change. The mood is informative and data-driven, with a clear legend indicating the color scale for GDP change. Notable details include the specific percentage changes labeled for each region and the color gradient representing economic growth or decline. ON-SCREEN TEXT: German NUTS 2 Regions – Real GDP per Capita Change 2019–2024 (cumulative CPI inflation ≈19.9%), Real GDP per Capita Change (%), 2019–2024, NUTS 2 regions (2016 boundaries), Change in real GDP per capita, chained prices (2015), %, Source: Eurostat, Destatis (corrected data), created by Mylordbebo
 Düsseldorf Germany skyline
 2Human cell aging reversed in Germany
 Vadym Y. arrest in Germany spying case
 Germany state media mandate on X
 Cologne Cathedral Germany
 Cologne Cathedral Germany
 Germany revokes Syrian refugee status
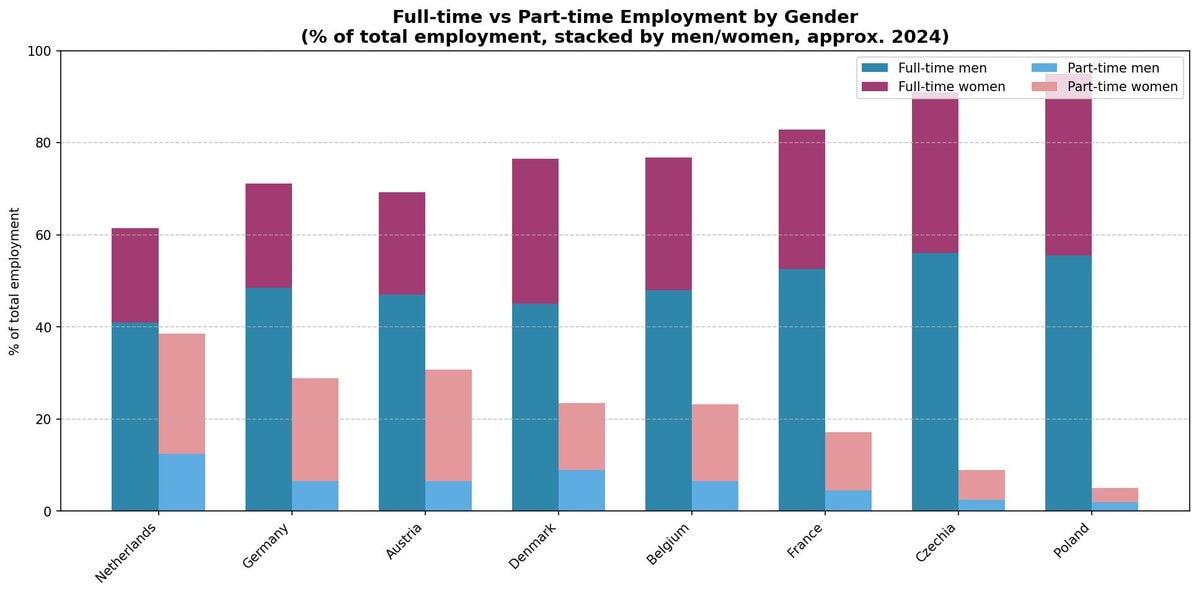 germany poland employment gender chart
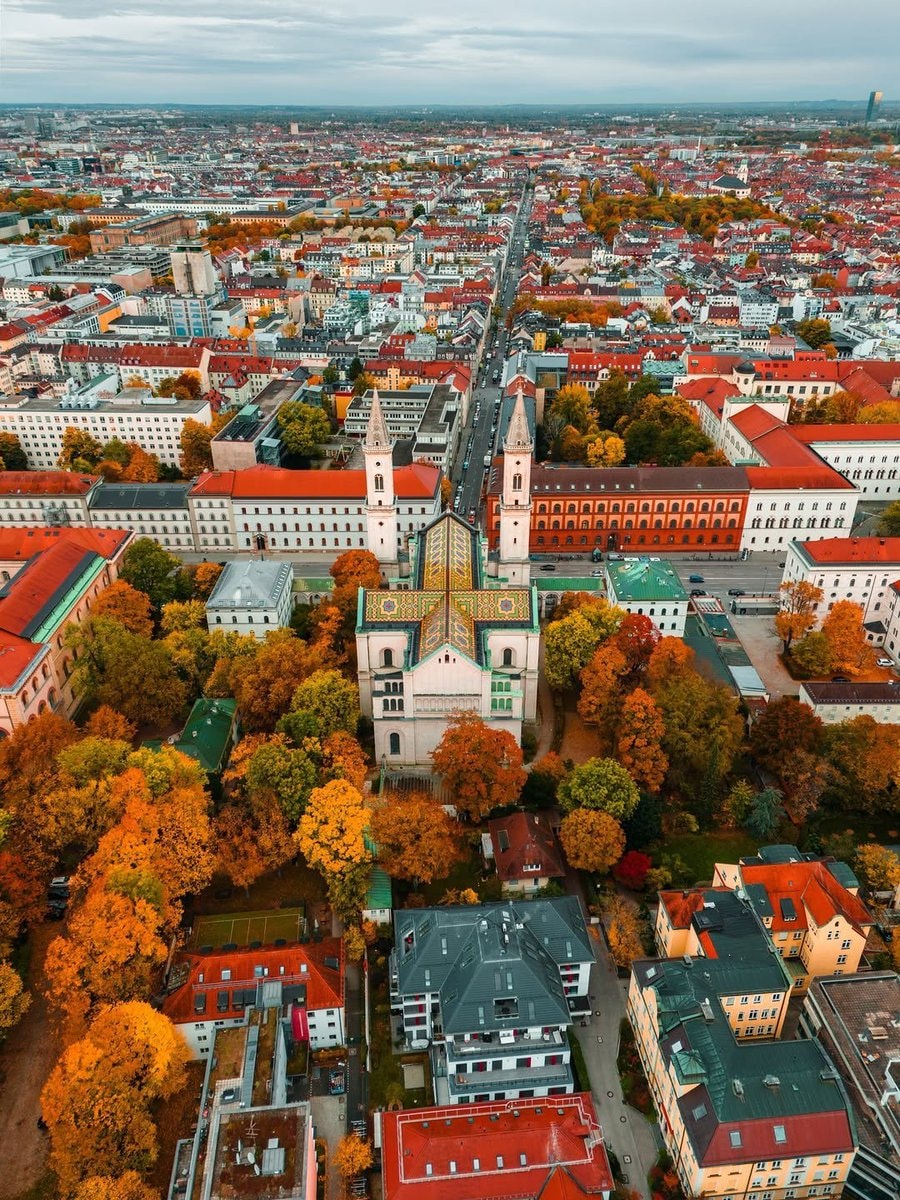 2Munich Germany autumn
 Berlin rent plan backfires on tenants
 Great Freedom Franz Rogowski
 AfD Alice Weidel EU reform plan
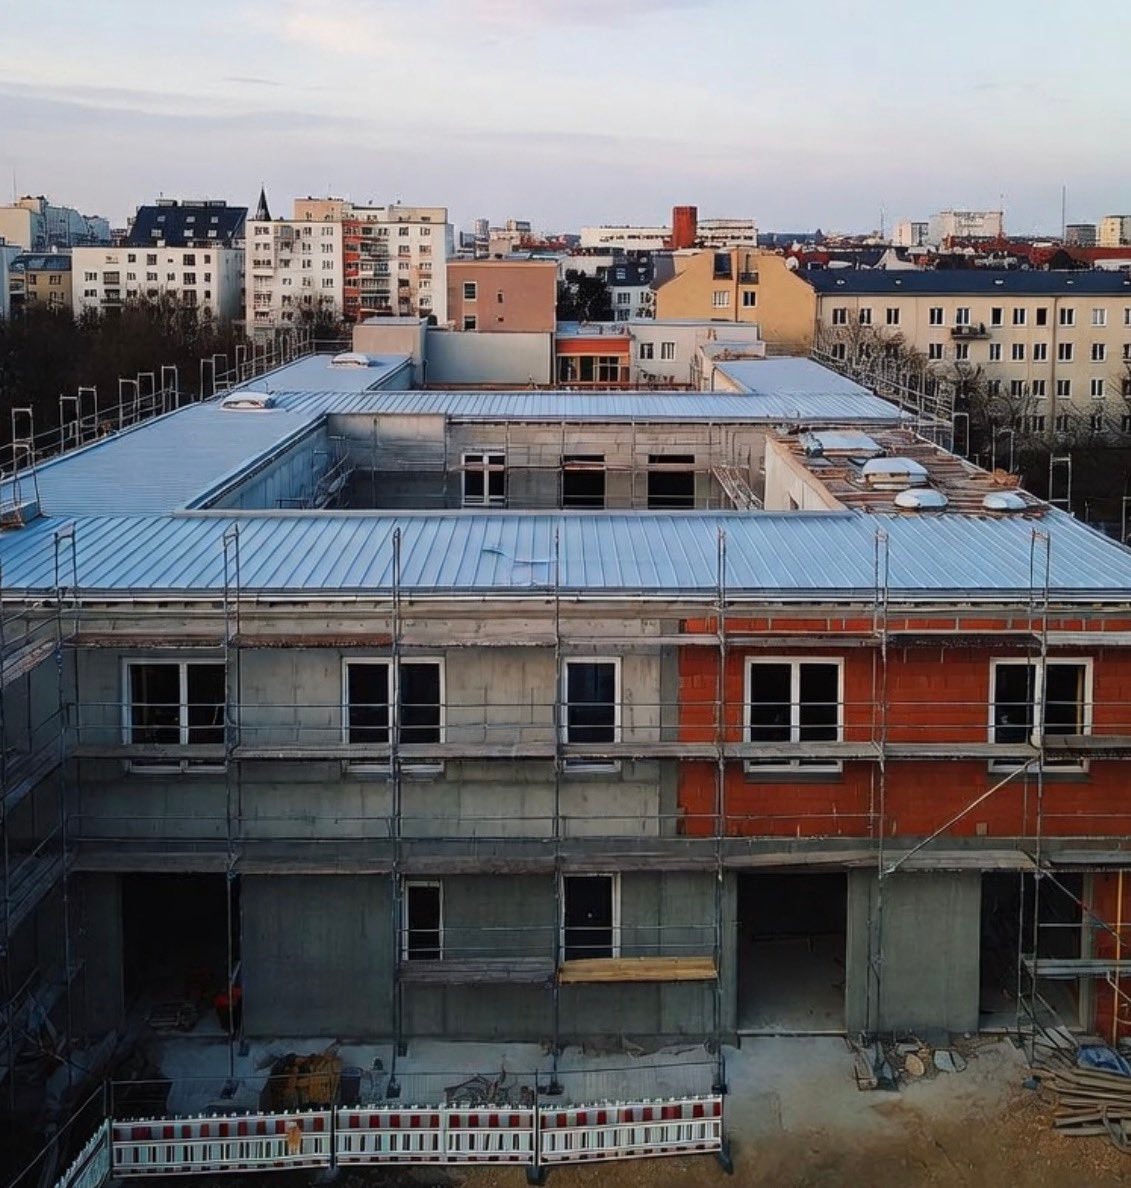 Berlin housing policy contradiction
 Heidelberg, Germany
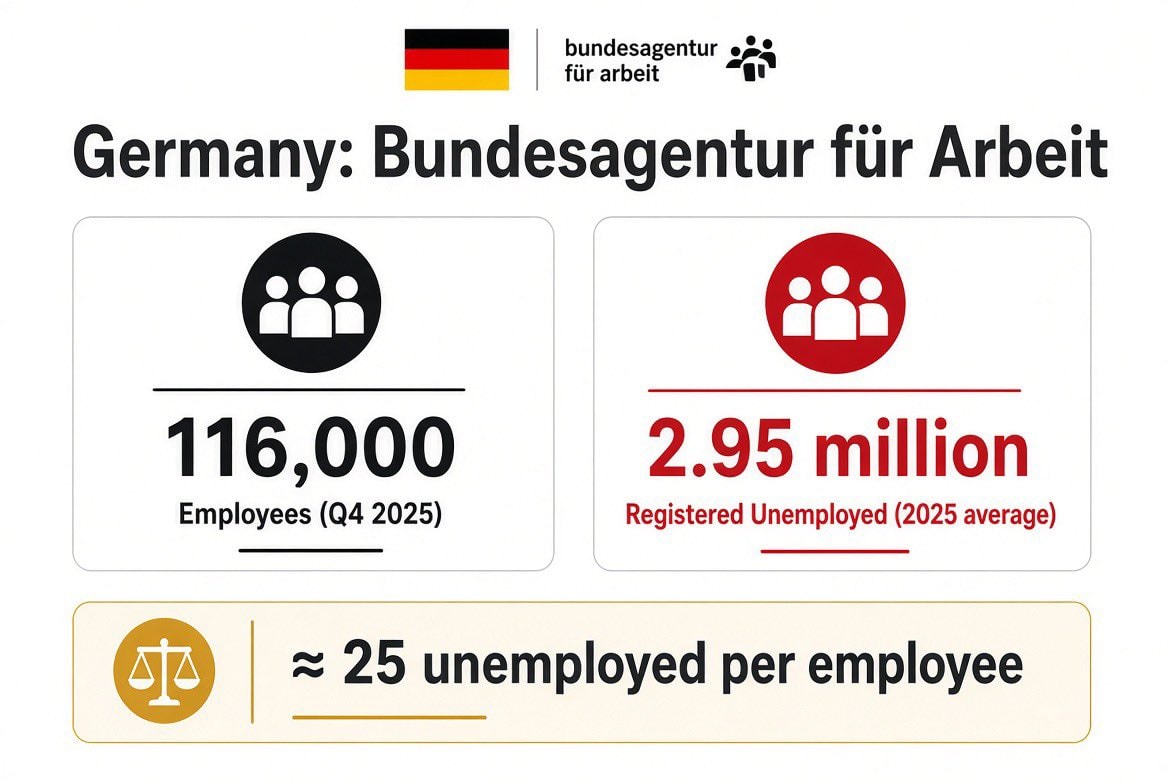 German unemployment agency stats
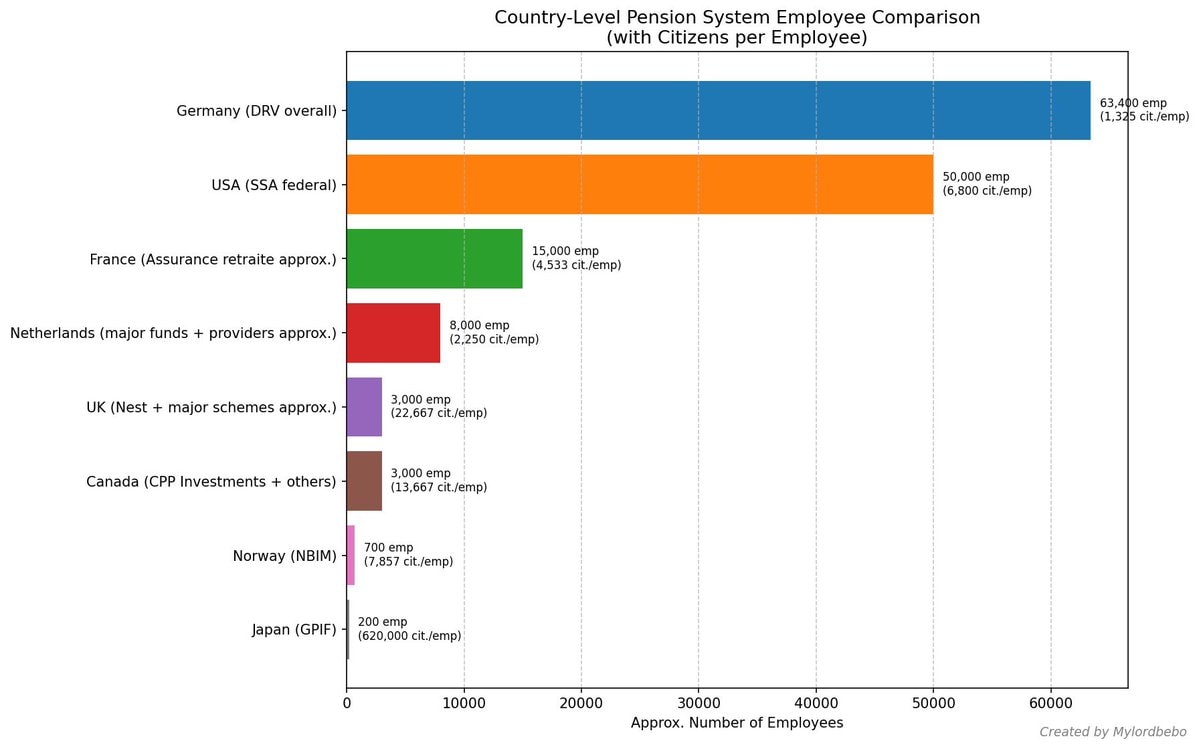 Germany DRV pension employees chart
 Cochem Castle Germany
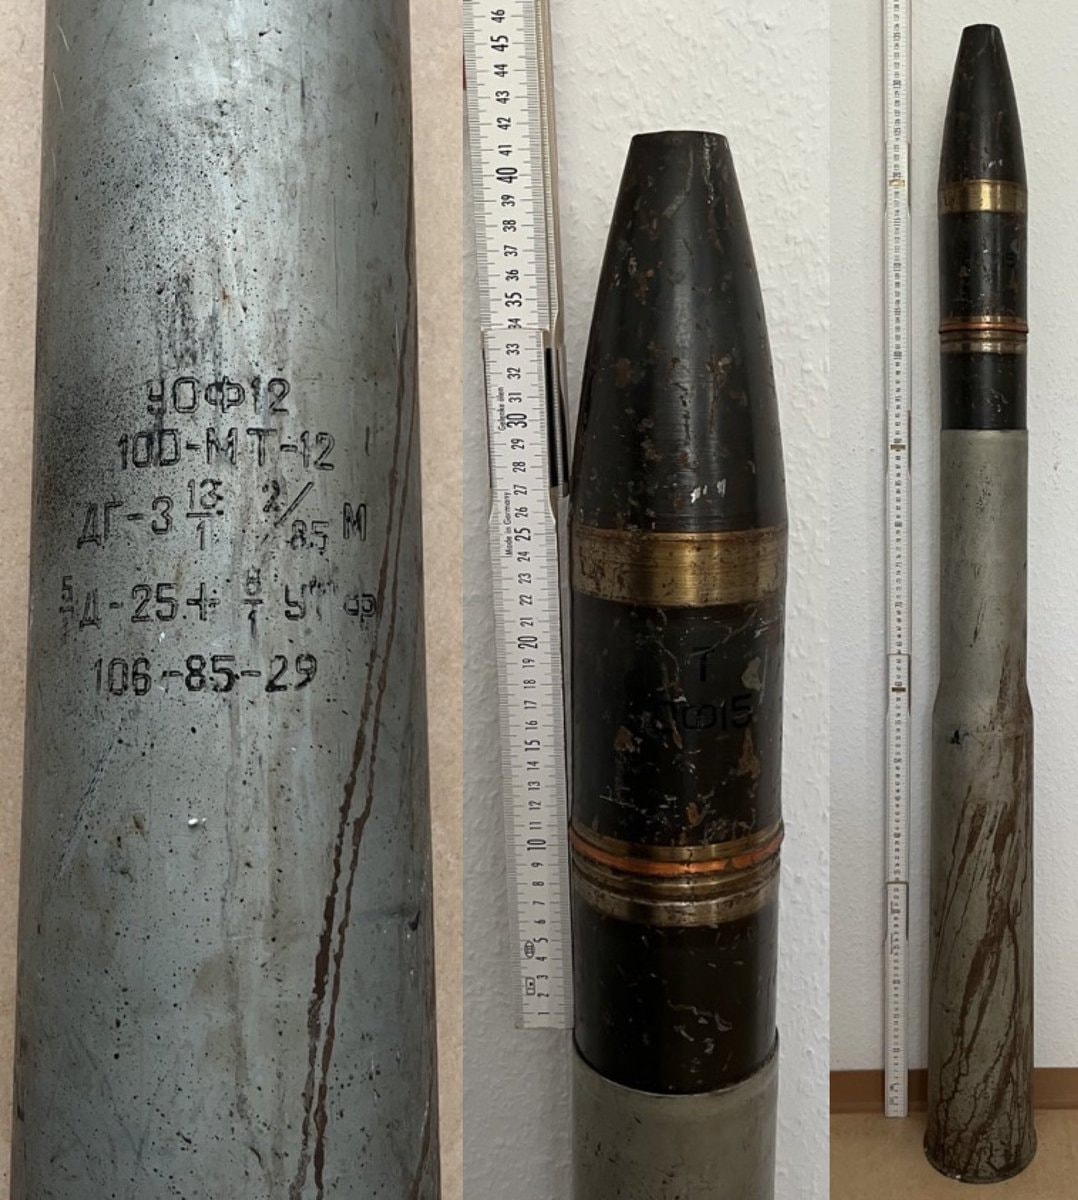 Russian artillery shells Germany
@not_a_newtthe industrial parts of germany are slowly drying out while the money pools in the big cities. that's a deindustrialization pattern showing up in german GDP, not just a rough patch.
View original postPhoto by @not_a_newt· Oct 23, 2026· Germany
The image is a map of Germany divided into NUTS 2 regions. The map shows the real GDP per capita change from 2019-2024, with regions colored according to their percentage change. The mood is informative and data-driven, with a clear legend indicating the color scale for GDP change. Notable details include the specific percentage changes labeled for each region and the color gradient representing economic growth or decline. ON-SCREEN TEXT: German NUTS 2 Regions – Real GDP per Capita Change 2019–2024 (cumulative CPI inflation ≈19.9%), Real GDP per Capita Change (%), 2019–2024, NUTS 2 regions (2016 boundaries), Change in real GDP per capita, chained prices (2015), %, Source: Eurostat, Destatis (corrected data), created by Mylordbebo
Düsseldorf Germany skyline2Human cell aging reversed in GermanyVadym Y. arrest in Germany spying caseGermany state media mandate on XCologne Cathedral GermanyCologne Cathedral GermanyGermany revokes Syrian refugee statusgermany poland employment gender chart2Munich Germany autumnBerlin rent plan backfires on tenantsGreat Freedom Franz RogowskiAfD Alice Weidel EU reform planBerlin housing policy contradictionHeidelberg, GermanyGerman unemployment agency statsGermany DRV pension employees chartCochem Castle GermanyRussian artillery shells Germany