About this photo
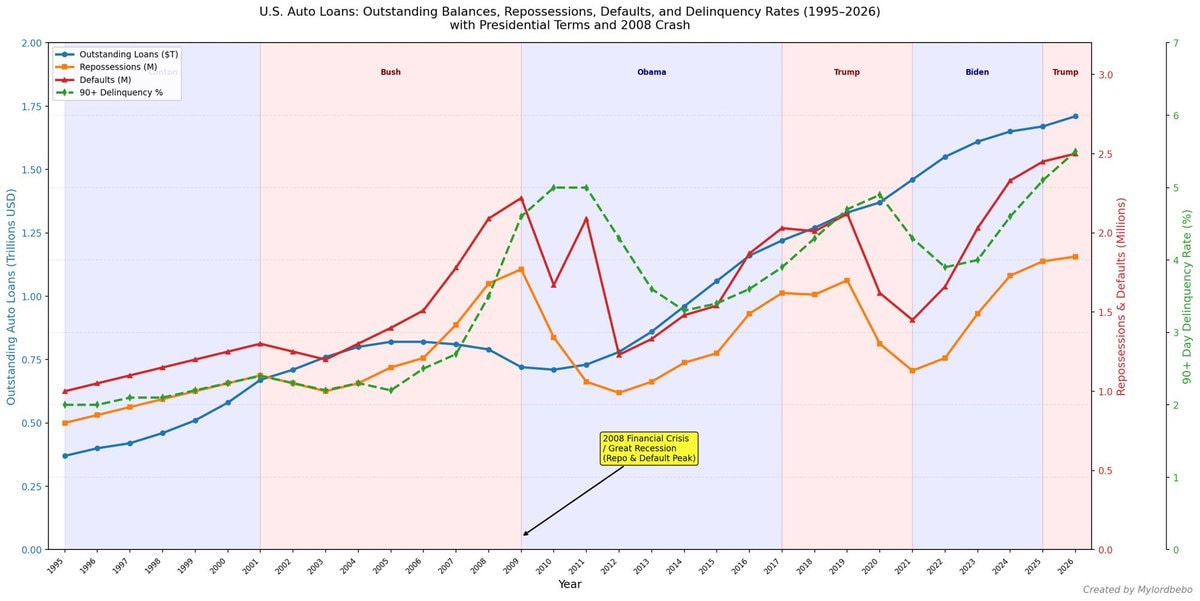
The image is a line graph showing U.S. Auto Loans data from 1995-2026. The focus is on four key metrics: Outstanding Loans, Repossessions, Defaults, and 90+ Day Delinquency Rate. The graph is divided by presidential terms, with Bush, Obama, Trump, and Biden labeled. A yellow callout box highlights the "2008 Financial Crisis / Great Recession (Repo & Default Peak)". The mood is informative and analytical, presented in a clean, data-driven style. Visually notable are the distinct colored lines representing each metric and the shaded background indicating presidential administrations. The on-screen text includes the title "U.S. Auto Loans: Outstanding Balances, Repossessions, Defaults, and Delinquency Rates (1995-2026) with Presidential Terms and 2008 Crash", axis labels "Outstanding Auto Loans (Trillions USD)", "Year", "Repossessions & Defaults (Millions)", and "90+ Day Delinquency Rate (%)",