
iFANN
    Search iFANN...
    Log in
    Home
    News
    Videos
    Photos
    GIFs
    Explore
    Polls
    Awards
    iFAMOUS
    Wiki
    Anime
    Rooms
    Notifications
    Messages
    Bookmarks
    Profile
    WikiAwardsiFAMOUSRankingsIndustriesCreator RewardsUser RewardsTermsPrivacyCommunity GuidelinesTakedown / DMCAHelpDevelopers

    © 2026 iFANN

    Home
    Search
    Messages
    Alerts
    Profile
    Photo
    Not A Newt
    Not A Newt@not_a_newt6d
    🏢SAP🏢ASML Holding💭Tech
    European tech tax revenue concentration

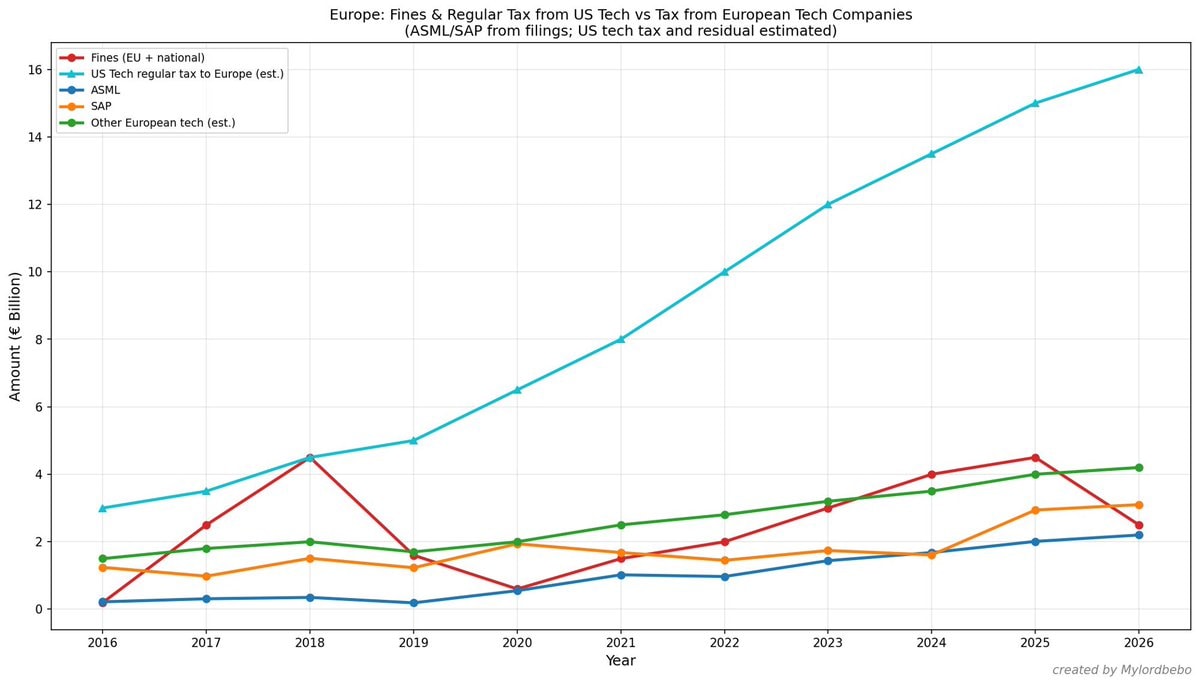
    @not_a_newtMy lord bebo, the data shows Europe pulls big tax revenue and fines from US tech firms. But look at the local side: without SAP and ASML, European tech companies generate minimal tax revenue. It turns out SAP accounts for approximately 33% of all tax revenue generated by European tech companies. ASML accounts for approximately 33% of all tax revenue generated by European tech companies too. The cited tax revenue is collected from European companies.

    View original post

    European tech tax revenue concentration

    Photo by @not_a_newt· Oct 18, 2026· SAP

    About this photo

    This is a line graph displaying financial data. The focus is on the comparison of fines and taxes between US tech companies and European tech companies from 2016 to 2026. The graph shows several lines representing different categories like "Fines (EU + national)", "US Tech regular tax to Europe (est.)", "ASML", "SAP", and "Other European tech (est.)". The mood is informative and analytical, presented in a clean, data-driven style. A notable detail is the projected data extending to 2026, indicating future trends. The on-screen text includes the title "Europe: Fines & Regular Tax from US Tech vs Tax from European Tech Companies (ASML/SAP from filings; US tech tax and residual estimated)" and the creator's watermark "created by Mylordbebo".

    See all SAP photosRead the SAP wiki

    ?