iFANN
    Search iFANN...
    Log in
    Home
    News
    Videos
    Photos
    GIFs
    Explore
    Polls
    Awards
    iFAMOUS
    Wiki
    Anime
    Rooms
    Notifications
    Messages
    Bookmarks
    Profile
    WikiAwardsiFAMOUSRankingsIndustriesCreator RewardsUser RewardsTermsPrivacyCommunity GuidelinesTakedown / DMCAHelpDevelopers

    © 2026 iFANN

    Home
    Search
    Messages
    Alerts
    Profile
    Photo
    Jolyon
    Jolyon@jolyon1w
    💭Finance
    Michael Oliver market analysis

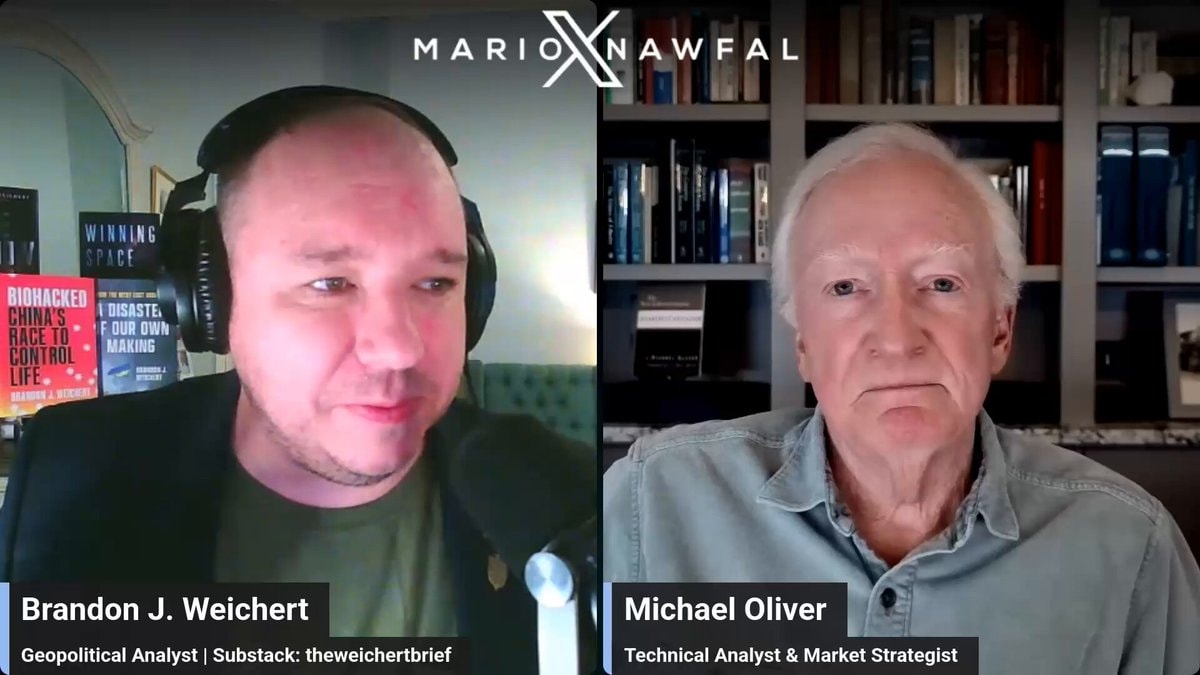
    @jolyonThe chart Michael Oliver is staring at shows US Treasuries hitting fresh lows while equity markets hold steady, yet the momentum data tells a different story. His studies focus on price force instead of price levels, and the six to eight biggest US banks are flashing patterns eerily similar to the S&P in September 1987. Visually, bank price charts look like a standard selloff, but the momentum indicators resemble the market conditions right before that crash. Multi-year structural patterns suggest a significant decline if they break, independent of any 1987-style event. He states clearly that if the financial sector breaks, every other sector falls with it. The bond market situation is described as a nuclear event involving Washington purchasing bonds and supporting the yen to prevent Japan from selling Treasuries, yet bond lows continue despite these interventions. The Fed's remaining policy tool is identified as printing money. Gold and silver prices may have already experienced a drop comparable to the 2008 crash, moving from January highs to summer lows over eight months with similar percentage declines. Oliver anticipates a rapid next market move and expresses greater concern regarding bank momentum indicators than artificial intelligence developments. Not advice. Just the chart he's staring at.

    View original post

    Michael Oliver market analysis

    Photo by @jolyon· Oct 1, 2026· Finance

    About this photo

    This is a split-screen video call featuring two men. The man on the left, Brandon J. Weichert, is wearing headphones and has several books behind him. The man on the right, Michael Oliver, is looking directly at the camera with a bookshelf behind him. The overall mood is professional and interview-like. ON-SCREEN TEXT: MARIOXNAWFAL, Brandon J. Weichert Geopolitical Analyst | Substack: theweichertbrief, Michael Oliver Technical Analyst & Market Strategist

    See all Finance photos

    ?

    More Finance photos

    See all Finance photos
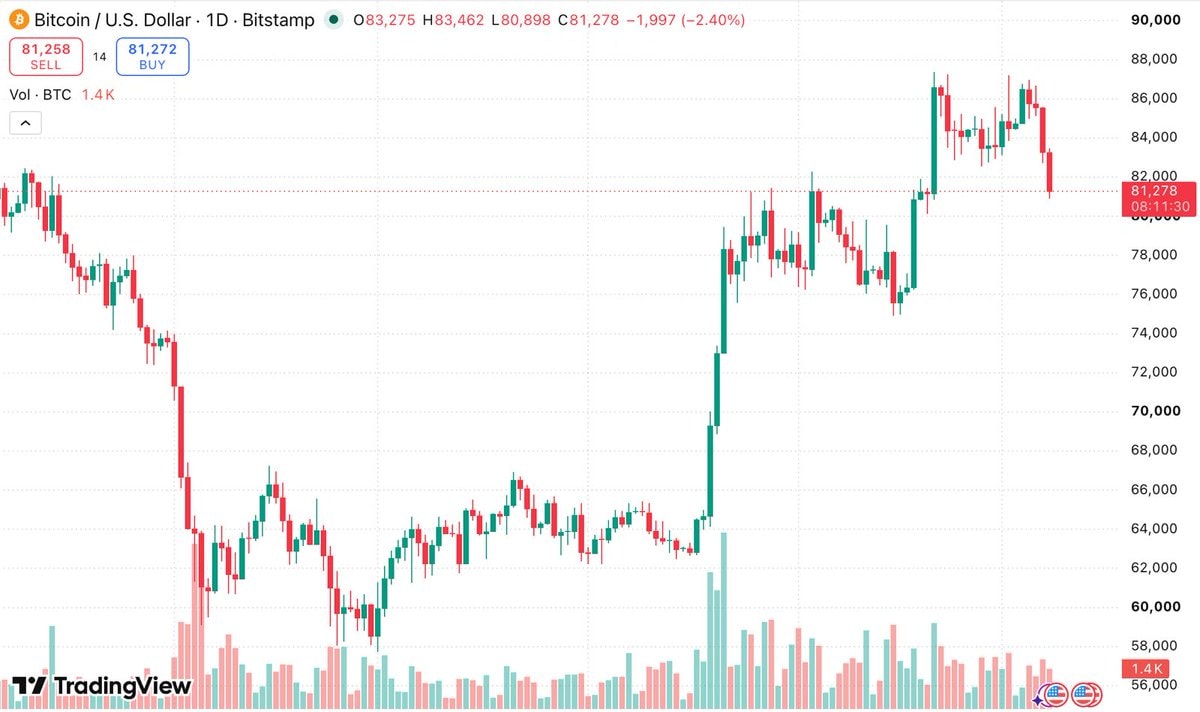
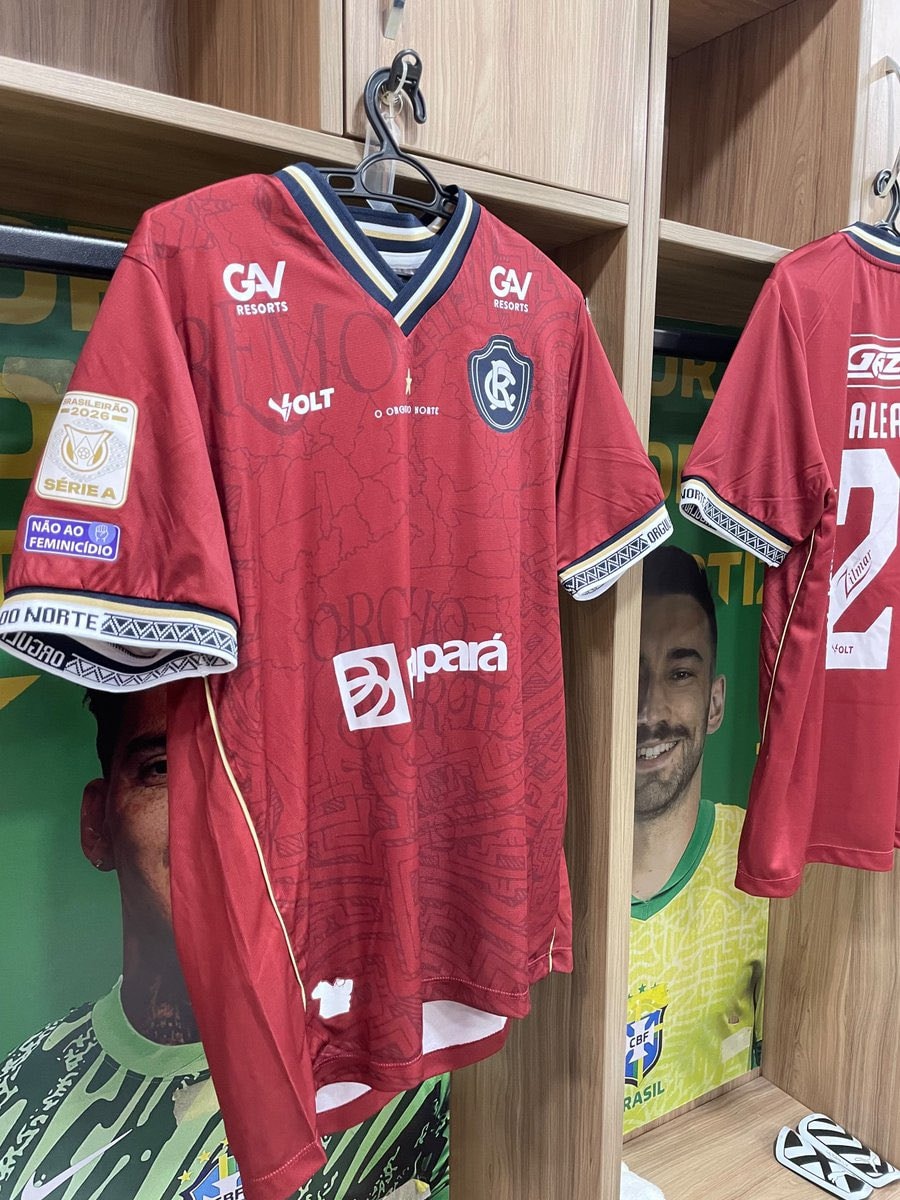
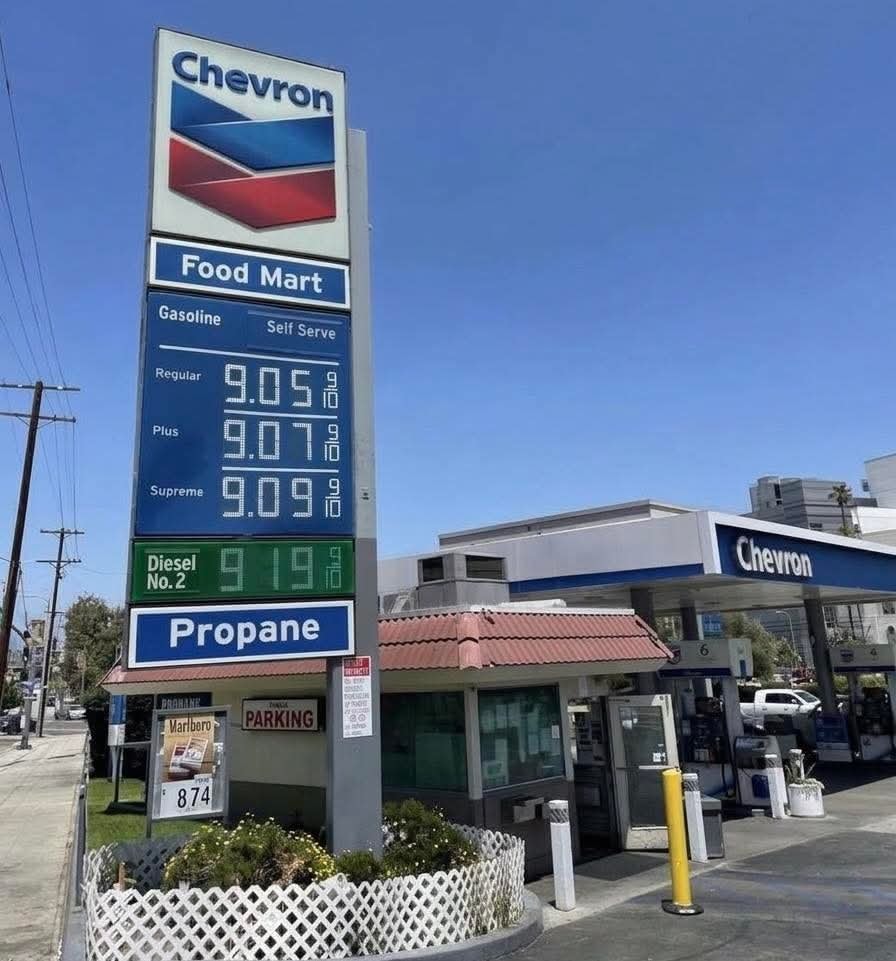
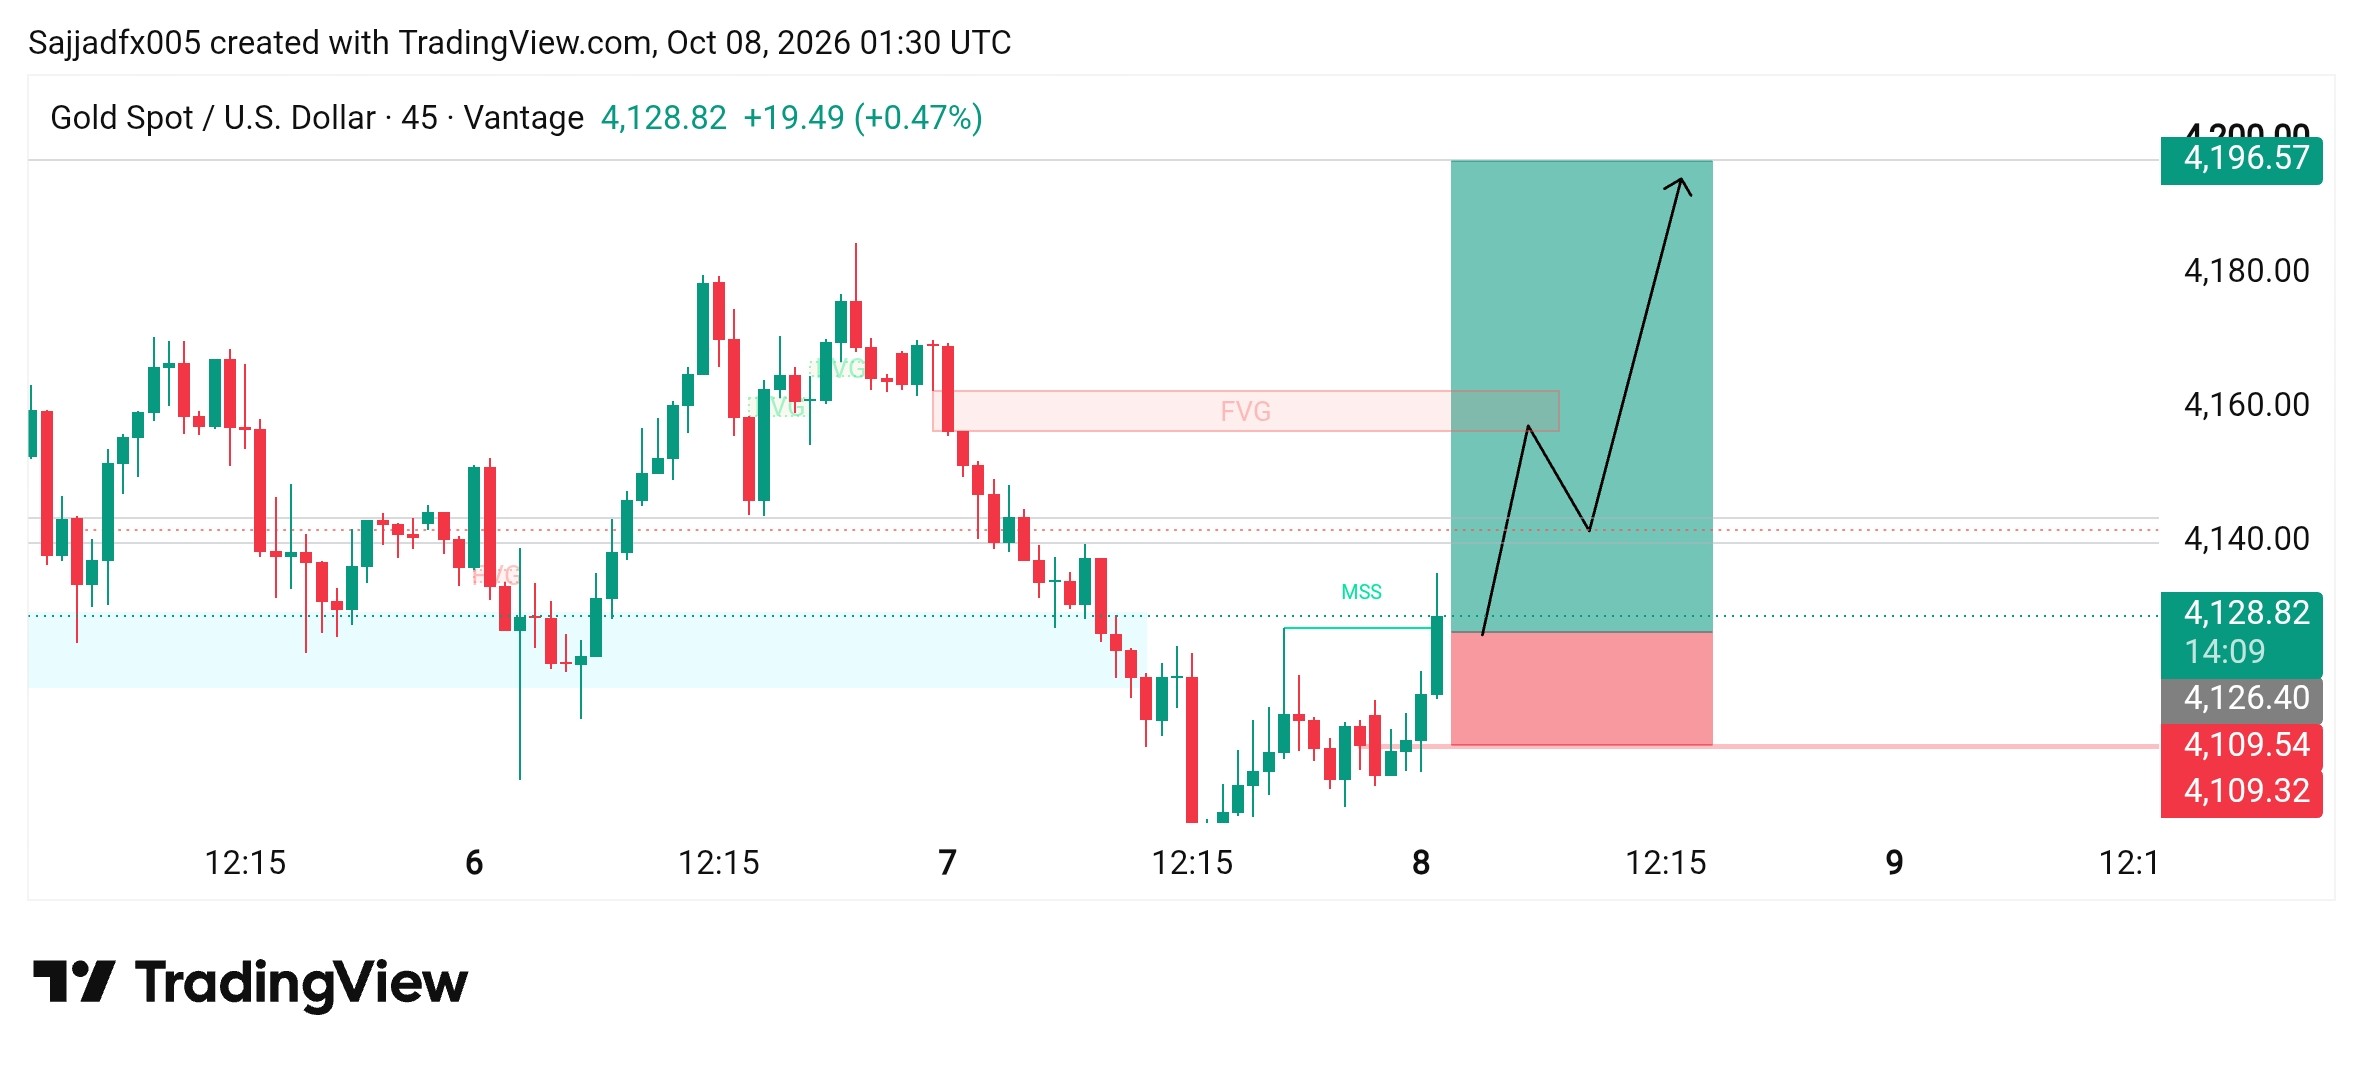
    China offshore trust tax2China offshore trust taxBitcoin price dropBitcoin price dropCrypto market liquidation eventCrypto market liquidation eventBitcoin price chart OliverBitcoin price chart OliverRemo BanPará master sponsor2Remo BanPará master sponsorWalnut Creek CA gas pricesWalnut Creek CA gas pricesGoldGoldXi Jinping China gold reserves2Xi Jinping China gold reservesBitcoin price chartBitcoin price chartPension funds exit AI trade as index funds keep buyingPension funds exit AI trade as index funds keep buyingChina bank consolidation and Chinese Yuan stacks2China bank consolidation and Chinese Yuan stacksUS 30-year Treasury yieldUS 30-year Treasury yieldRecent Recipients winnerRecent Recipients winnerHighest Inflation Rates by CountryHighest Inflation Rates by CountryBitcoin price chart dropBitcoin price chart dropUS home foreclosures surge2US home foreclosures surge
    Photo
    Jolyon
    Jolyon@jolyon1w
    💭Finance
    Michael Oliver market analysis

    @jolyonThe chart Michael Oliver is staring at shows US Treasuries hitting fresh lows while equity markets hold steady, yet the momentum data tells a different story. His studies focus on price force instead of price levels, and the six to eight biggest US banks are flashing patterns eerily similar to the S&P in September 1987. Visually, bank price charts look like a standard selloff, but the momentum indicators resemble the market conditions right before that crash. Multi-year structural patterns suggest a significant decline if they break, independent of any 1987-style event. He states clearly that if the financial sector breaks, every other sector falls with it. The bond market situation is described as a nuclear event involving Washington purchasing bonds and supporting the yen to prevent Japan from selling Treasuries, yet bond lows continue despite these interventions. The Fed's remaining policy tool is identified as printing money. Gold and silver prices may have already experienced a drop comparable to the 2008 crash, moving from January highs to summer lows over eight months with similar percentage declines. Oliver anticipates a rapid next market move and expresses greater concern regarding bank momentum indicators than artificial intelligence developments. Not advice. Just the chart he's staring at.

    View original post
    Michael Oliver market analysis

    Photo by @jolyon· Oct 1, 2026· Finance

    About this photo

    This is a split-screen video call featuring two men. The man on the left, Brandon J. Weichert, is wearing headphones and has several books behind him. The man on the right, Michael Oliver, is looking directly at the camera with a bookshelf behind him. The overall mood is professional and interview-like. ON-SCREEN TEXT: MARIOXNAWFAL, Brandon J. Weichert Geopolitical Analyst | Substack: theweichertbrief, Michael Oliver Technical Analyst & Market Strategist

    See all Finance photos

    ?

    More Finance photos

    See all Finance photos
    China offshore trust tax2China offshore trust taxBitcoin price dropBitcoin price dropCrypto market liquidation eventCrypto market liquidation eventBitcoin price chart OliverBitcoin price chart OliverRemo BanPará master sponsor2Remo BanPará master sponsorWalnut Creek CA gas pricesWalnut Creek CA gas pricesGoldGoldXi Jinping China gold reserves2Xi Jinping China gold reservesBitcoin price chartBitcoin price chartPension funds exit AI trade as index funds keep buyingPension funds exit AI trade as index funds keep buyingChina bank consolidation and Chinese Yuan stacks2China bank consolidation and Chinese Yuan stacksUS 30-year Treasury yieldUS 30-year Treasury yieldRecent Recipients winnerRecent Recipients winnerHighest Inflation Rates by CountryHighest Inflation Rates by CountryBitcoin price chart dropBitcoin price chart dropUS home foreclosures surge2US home foreclosures surge