About this photo
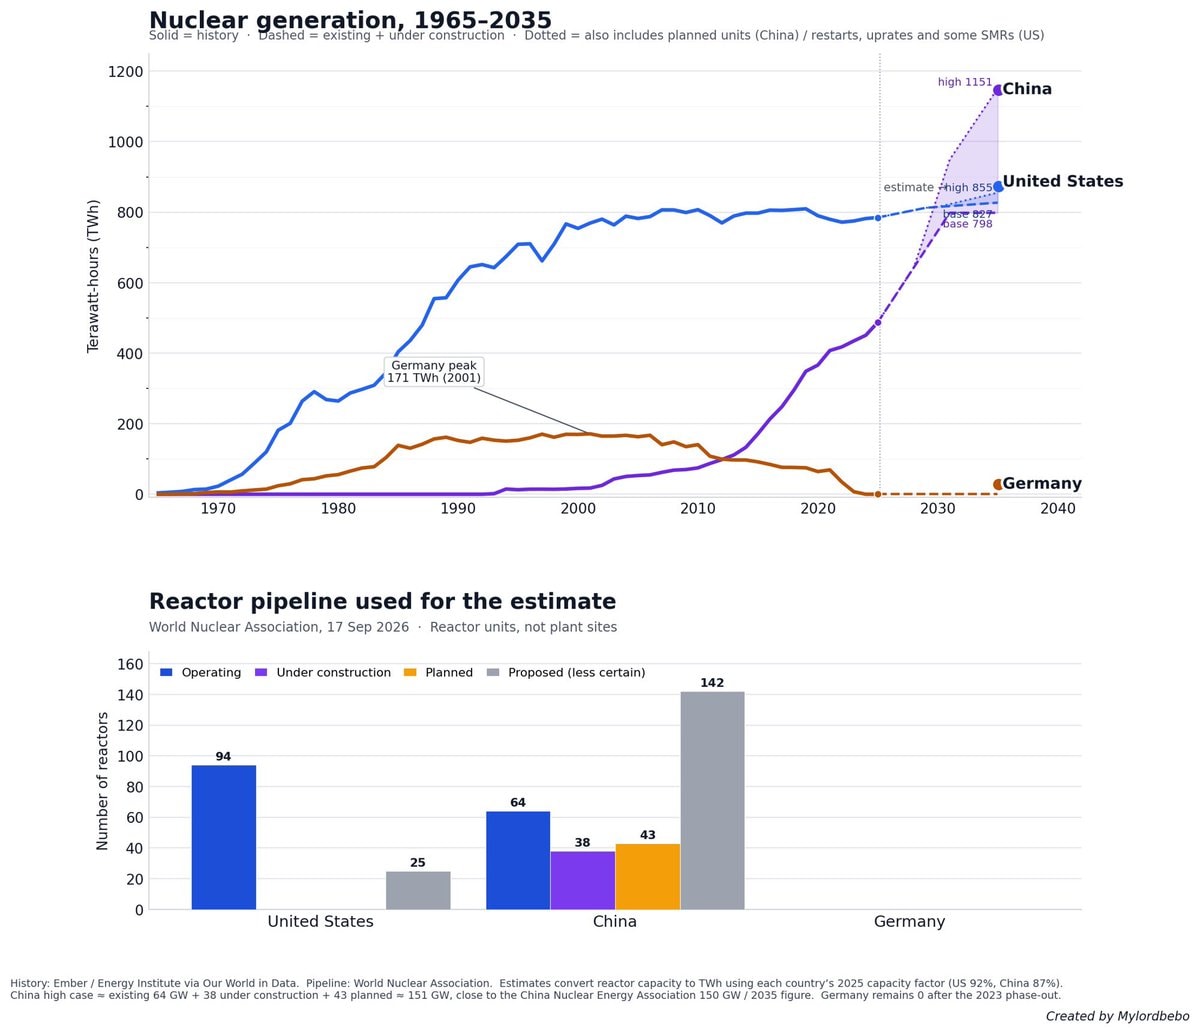
The image displays two charts about nuclear generation and reactor pipelines. The top chart shows nuclear generation in Terawatt-hours from 1965 to 2035 for China, the United States, and Germany. The bottom chart shows the reactor pipeline for the estimate, detailing operating, under construction, planned, and proposed reactors for the United States, China, and Germany. The mood is informative and data-driven, with a clean, infographic style. A notable detail is the projected steep increase in nuclear generation for China and the United States compared to Germany's decline. The on-screen text includes "Nuclear generation, 1965-2035", "Germany peak 171 TWh (2001)", "Reactor pipeline used for the estimate", "World Nuclear Association, 17 Sep 2026", "Reactor units, not plant sites", and "Created by Mylordbebo".

















No comments yet. Be the first!