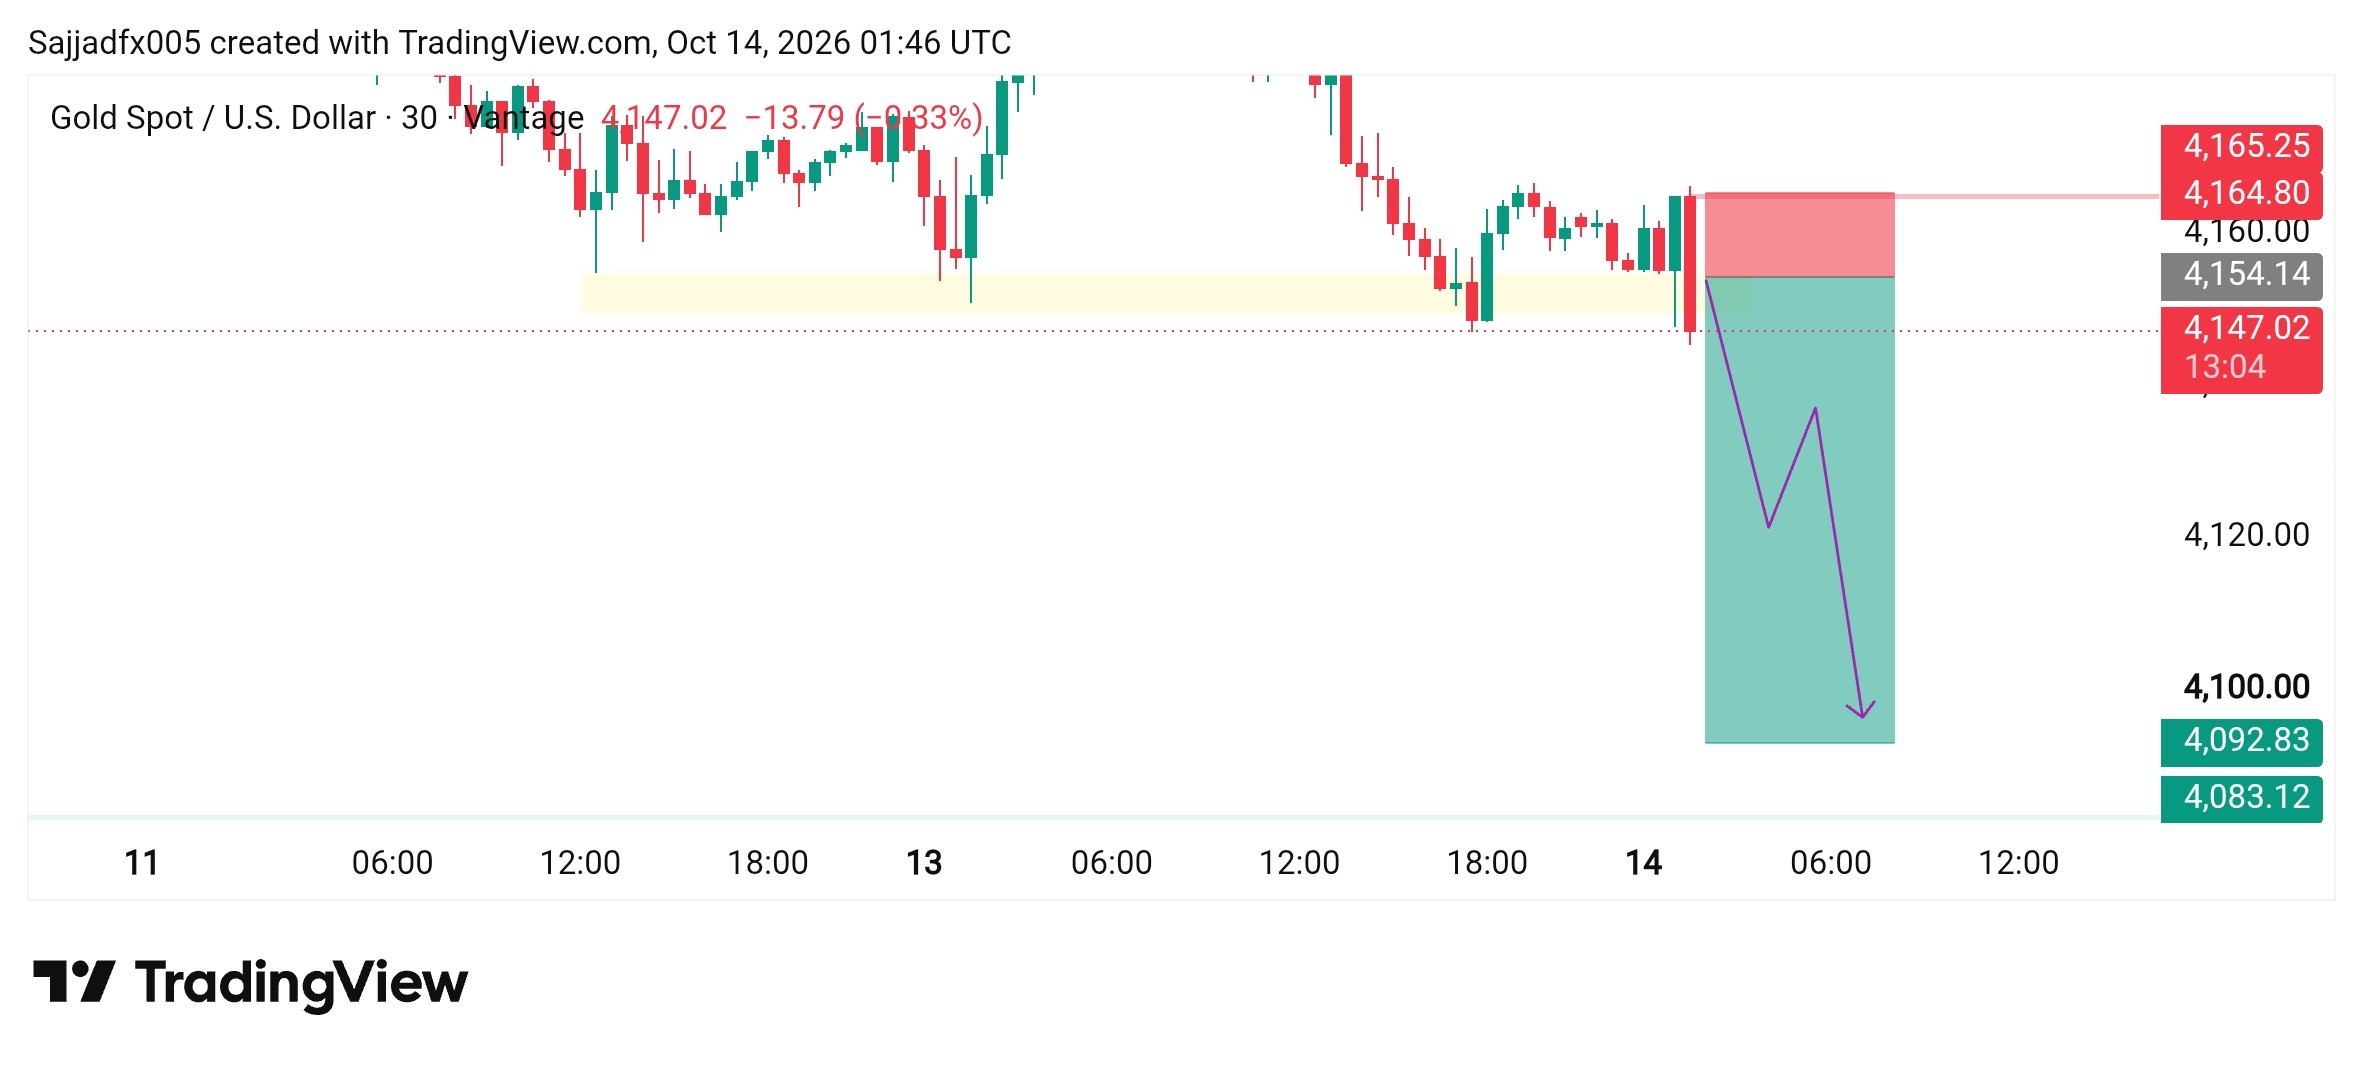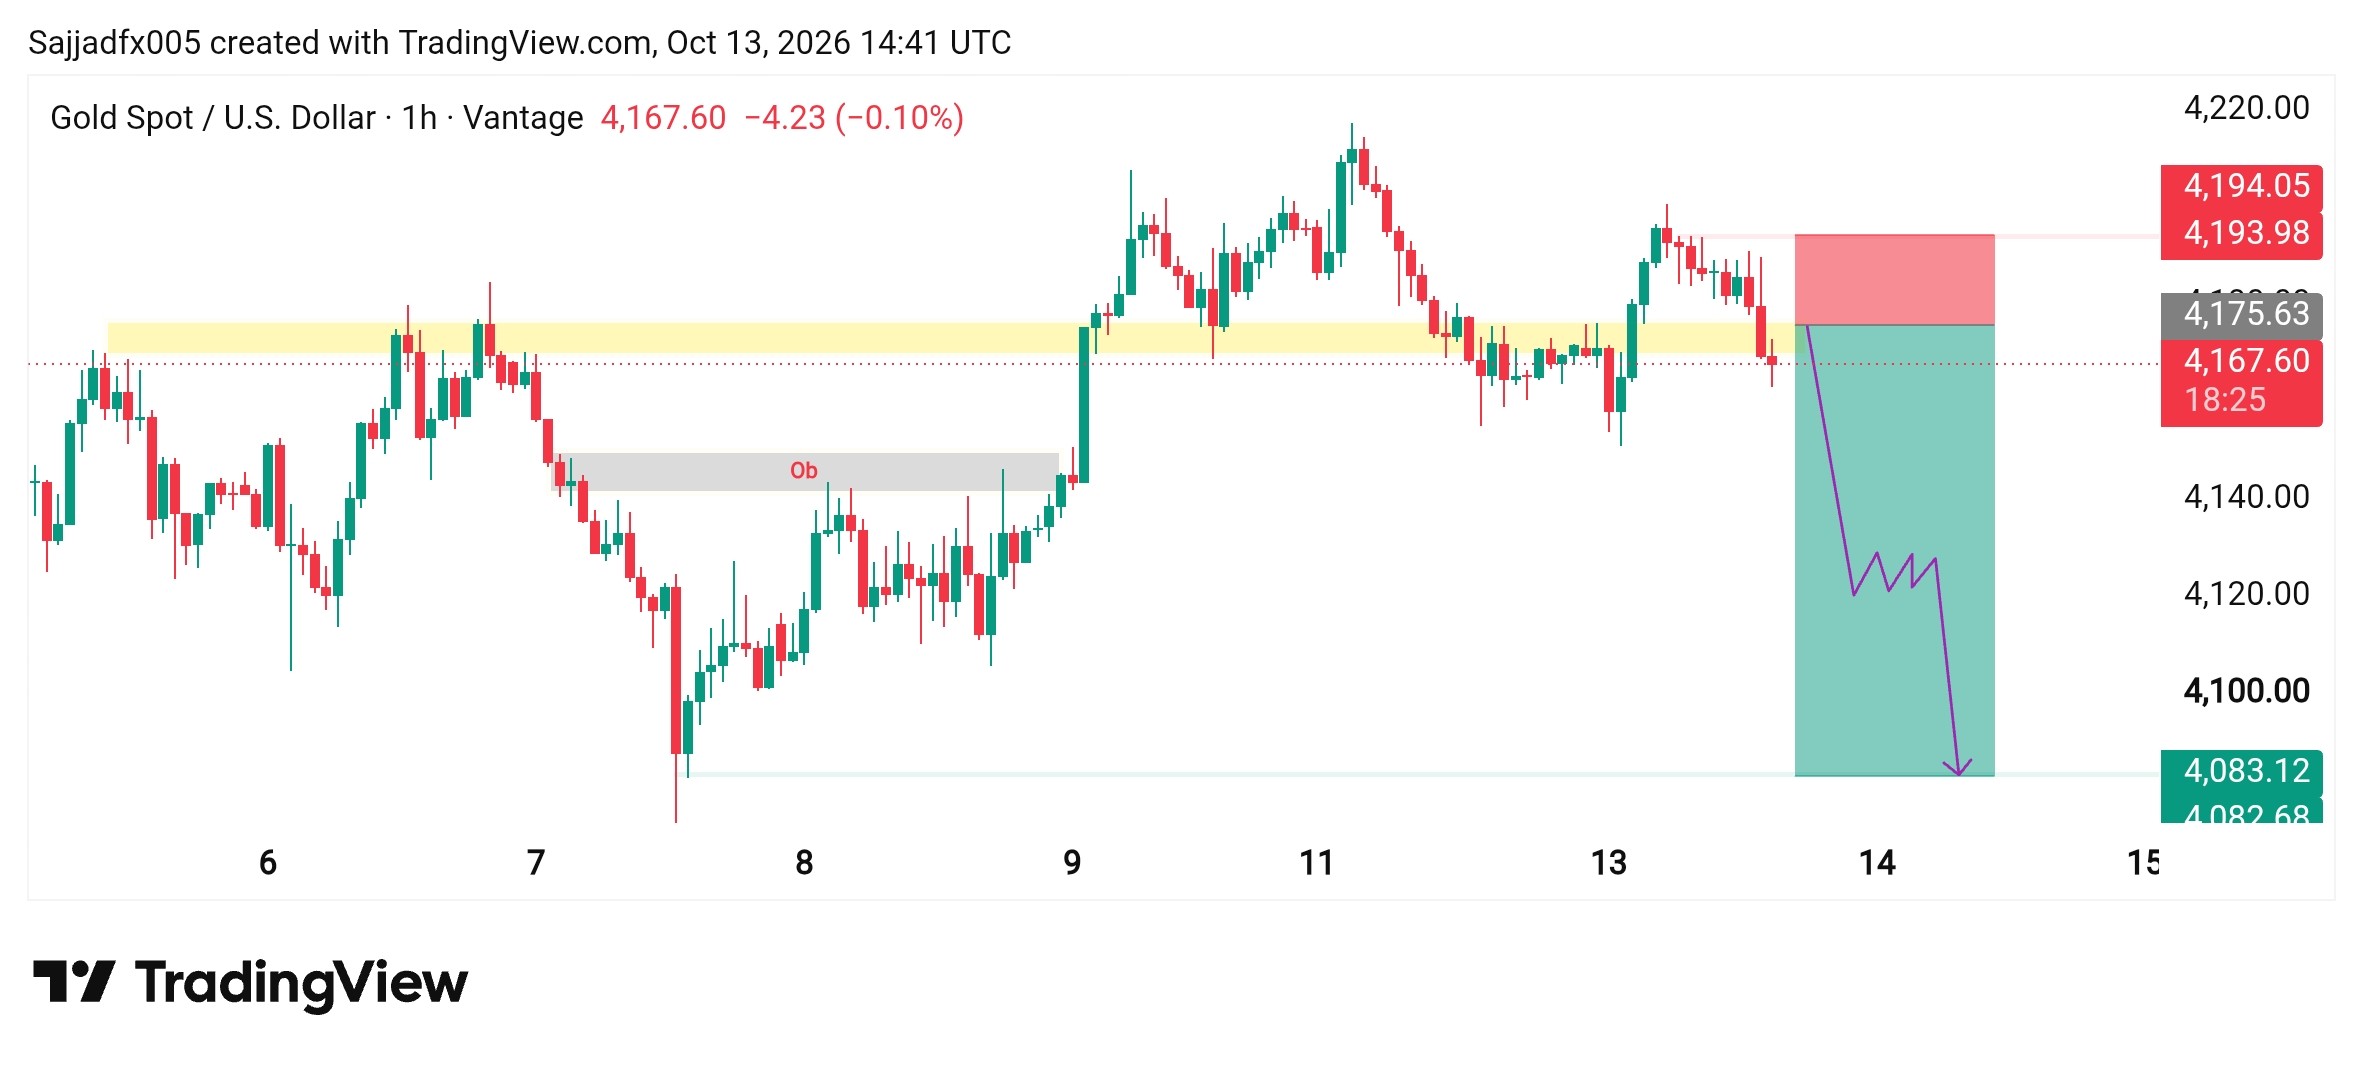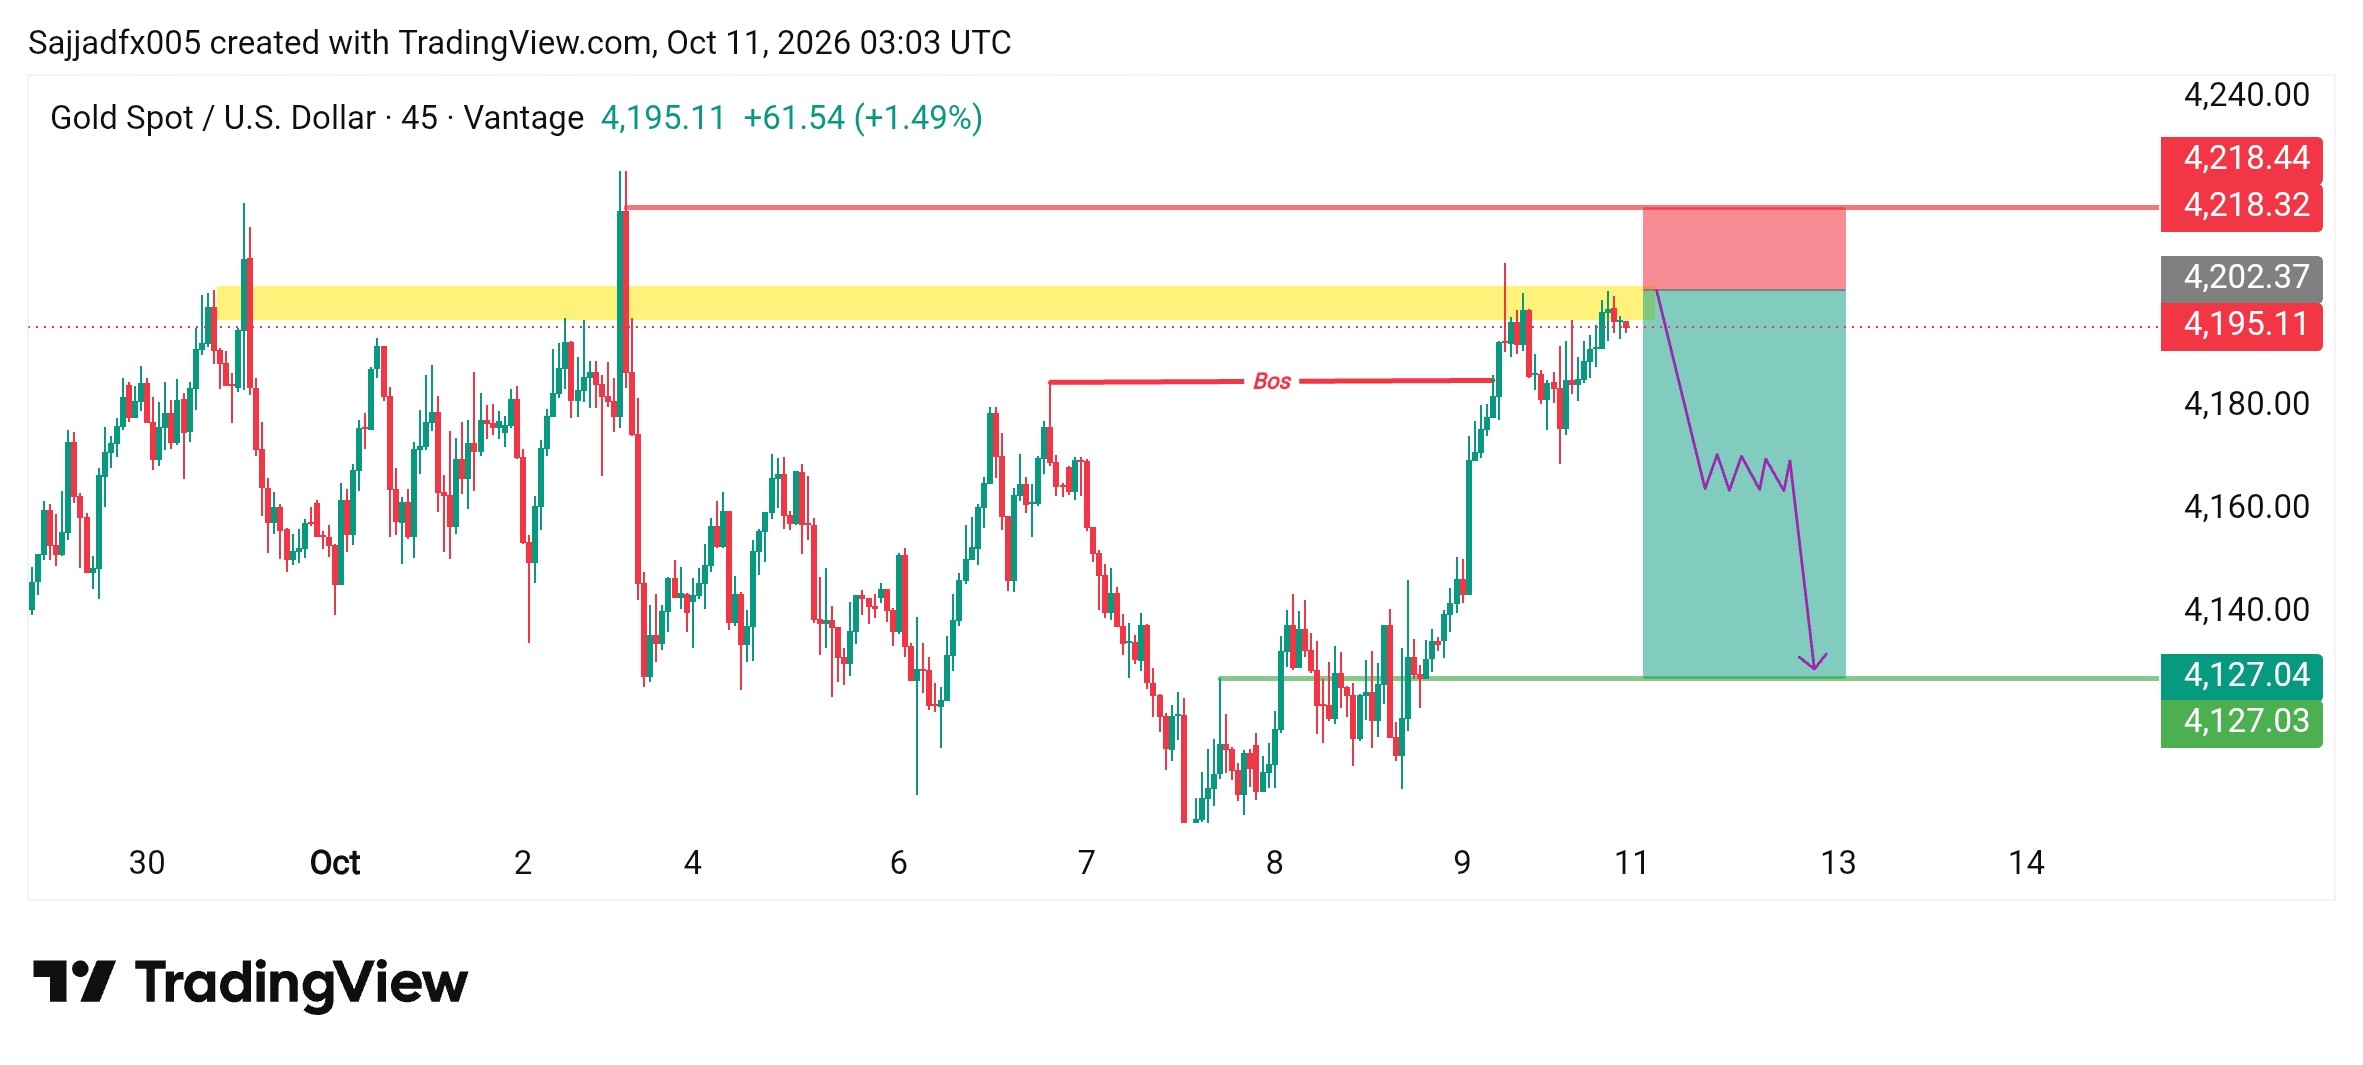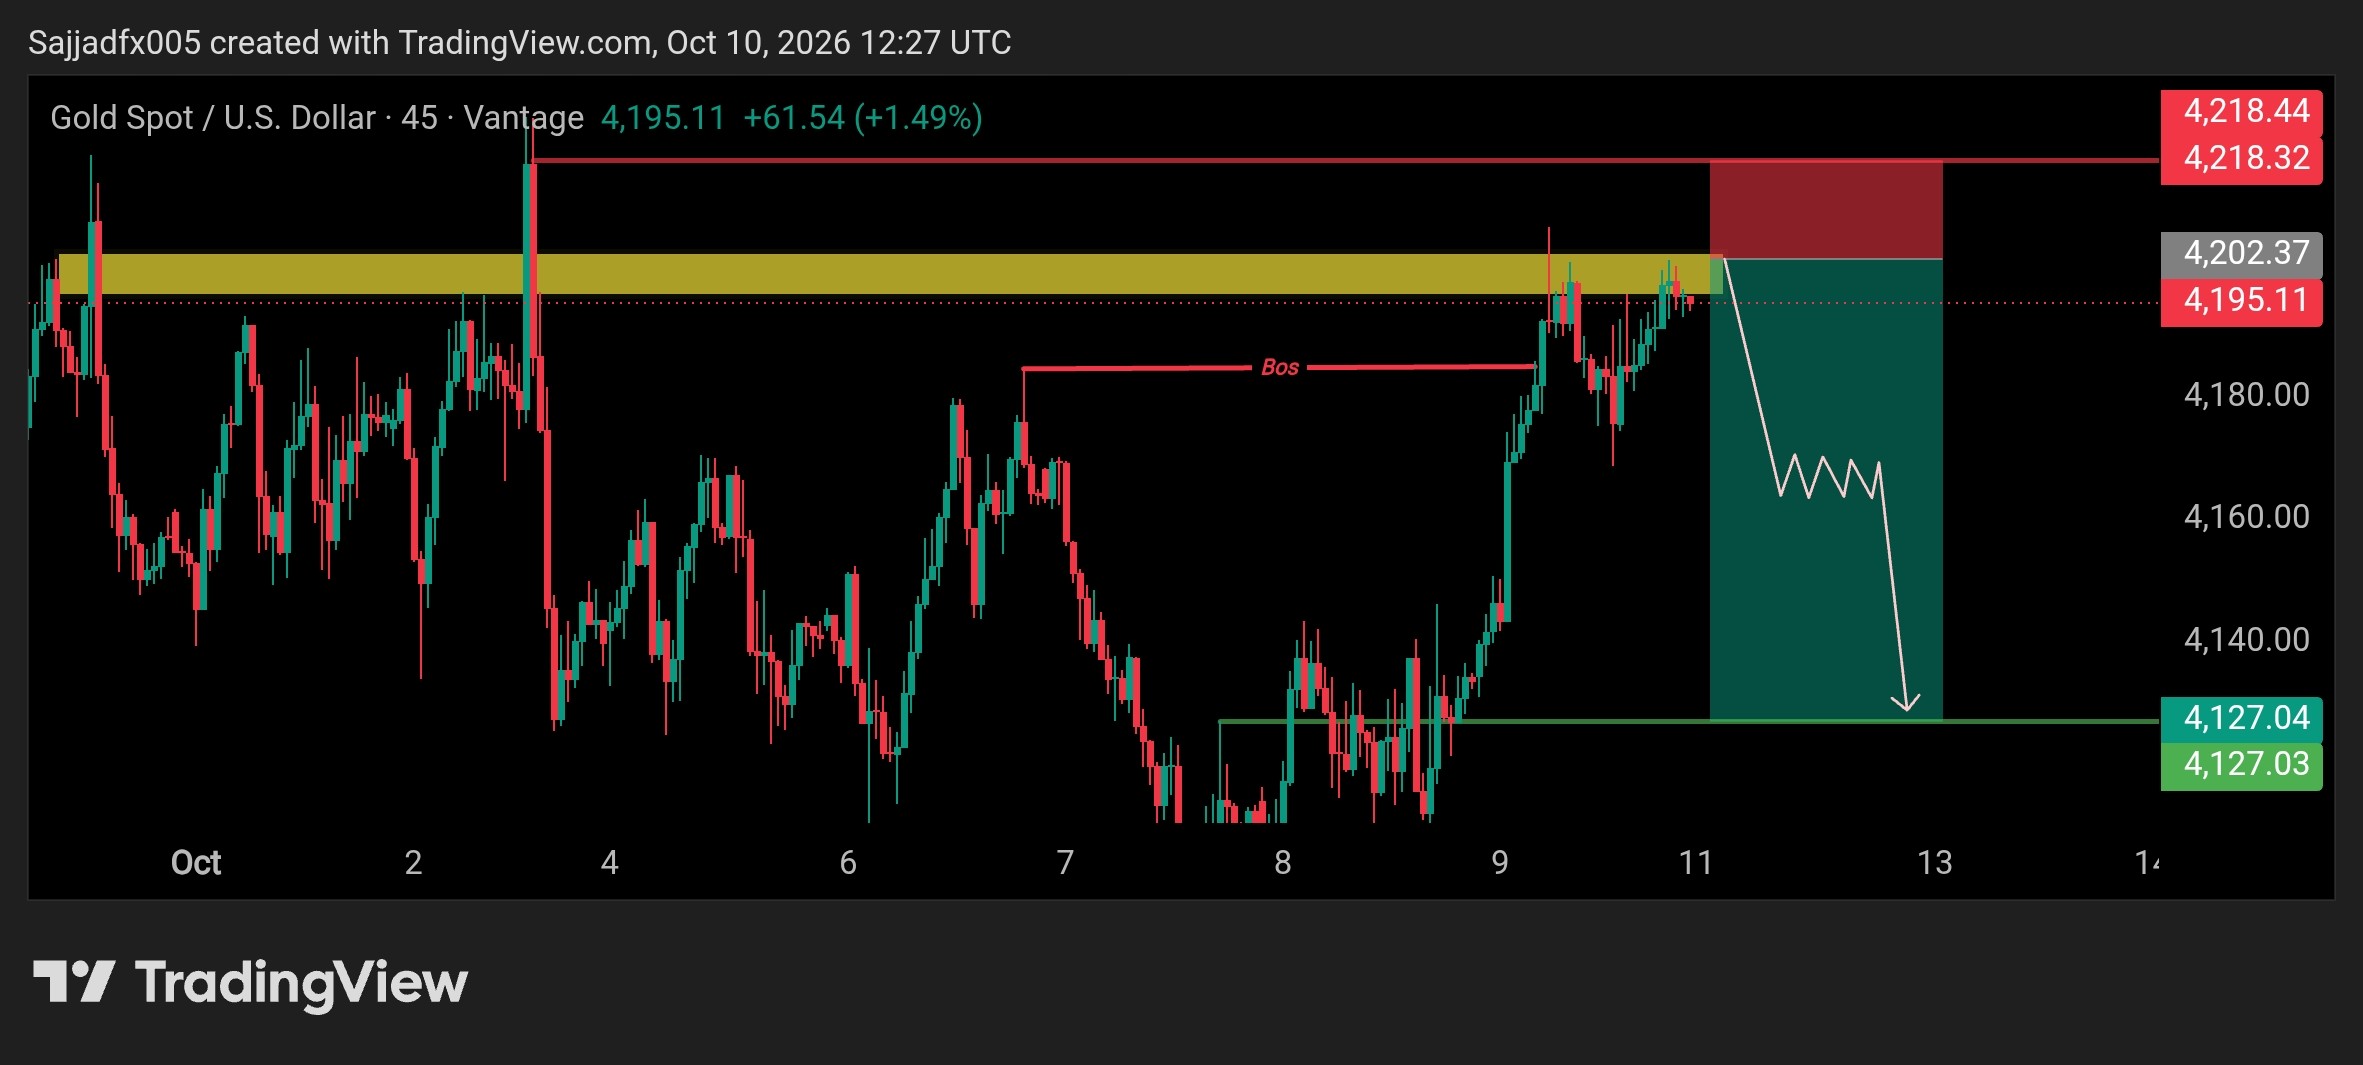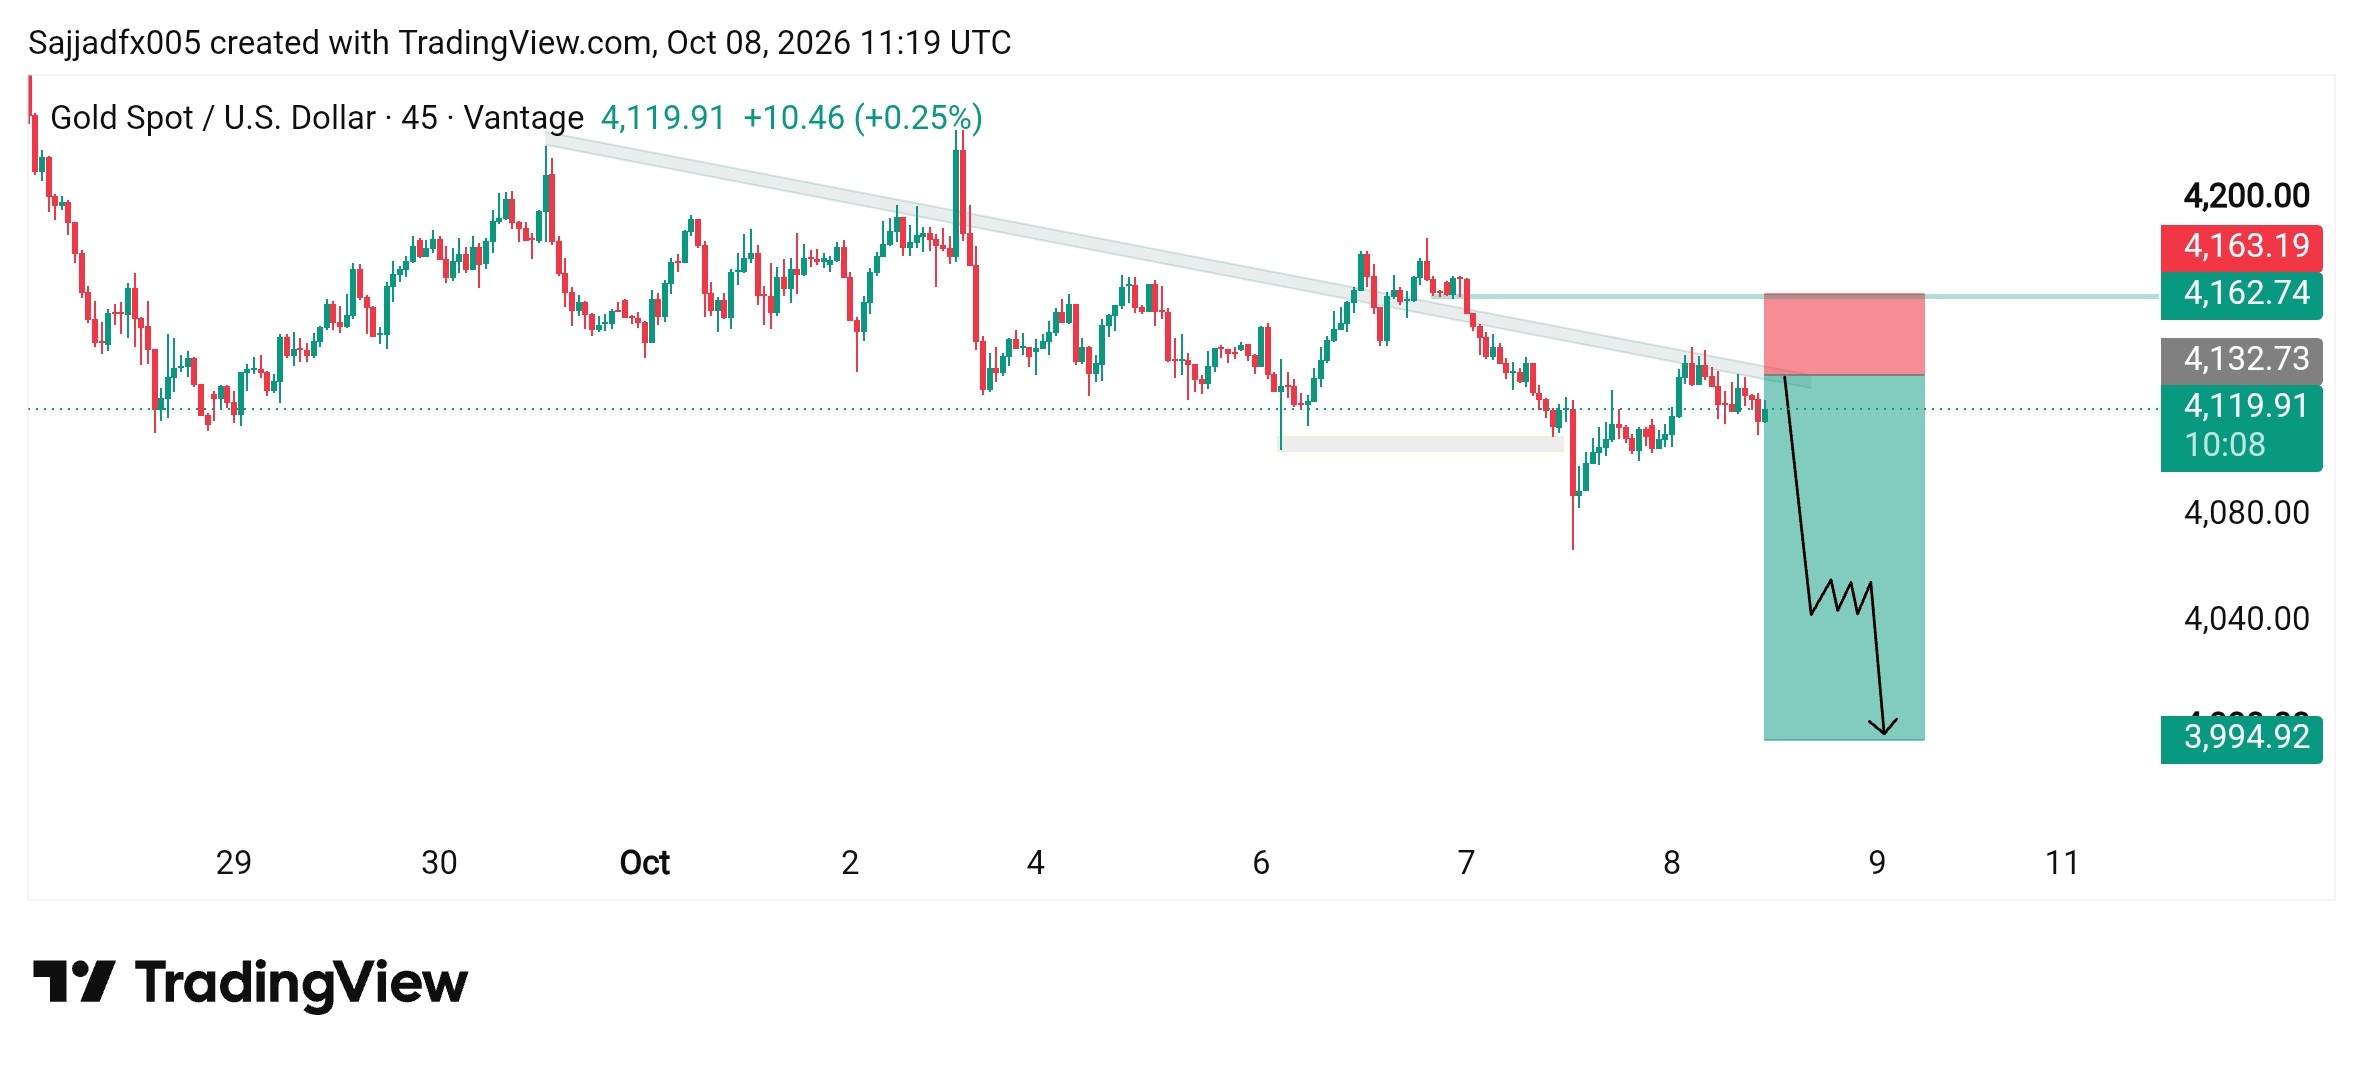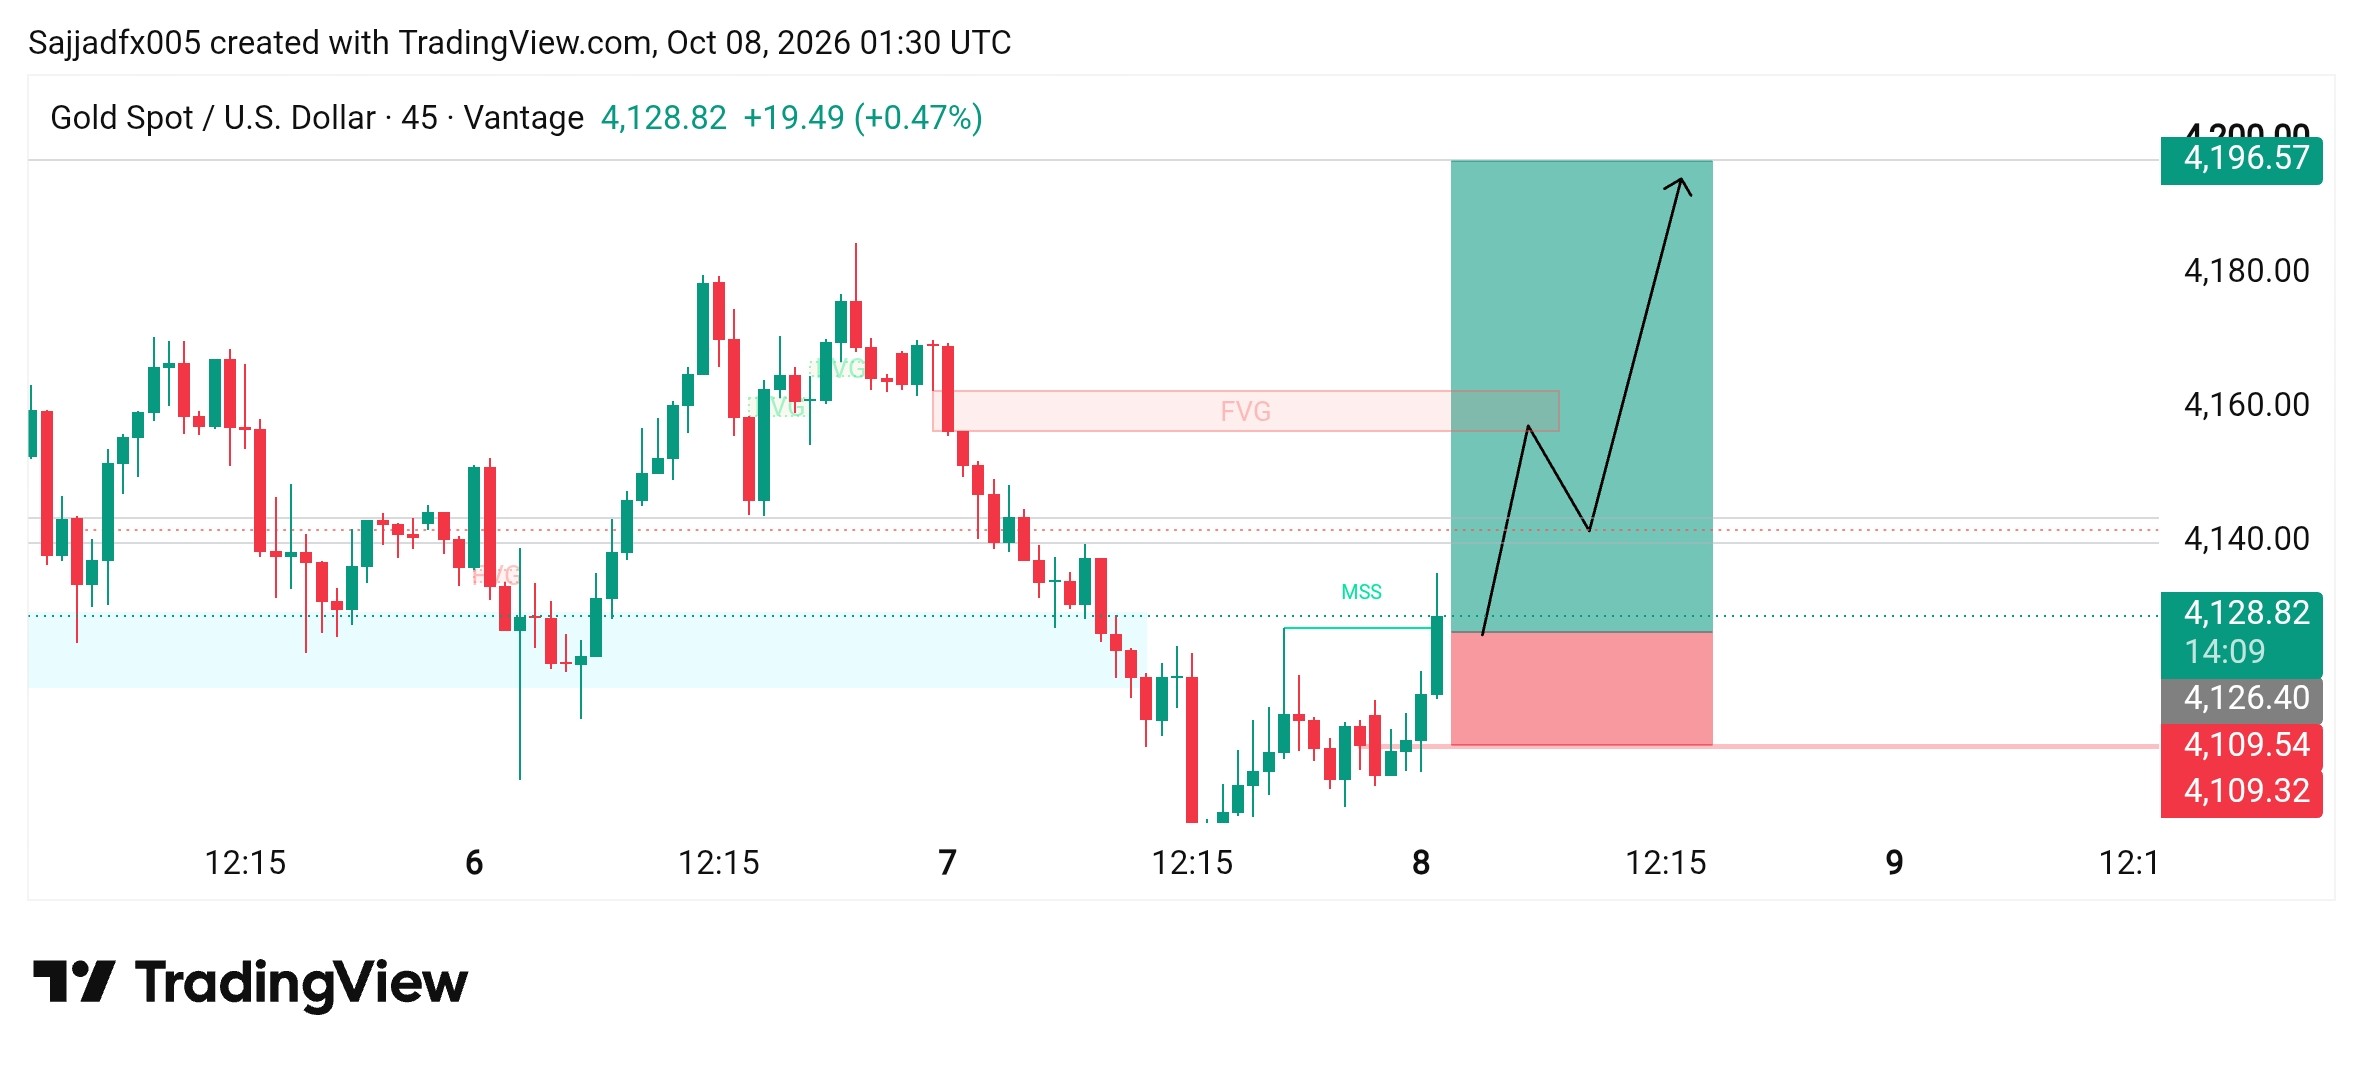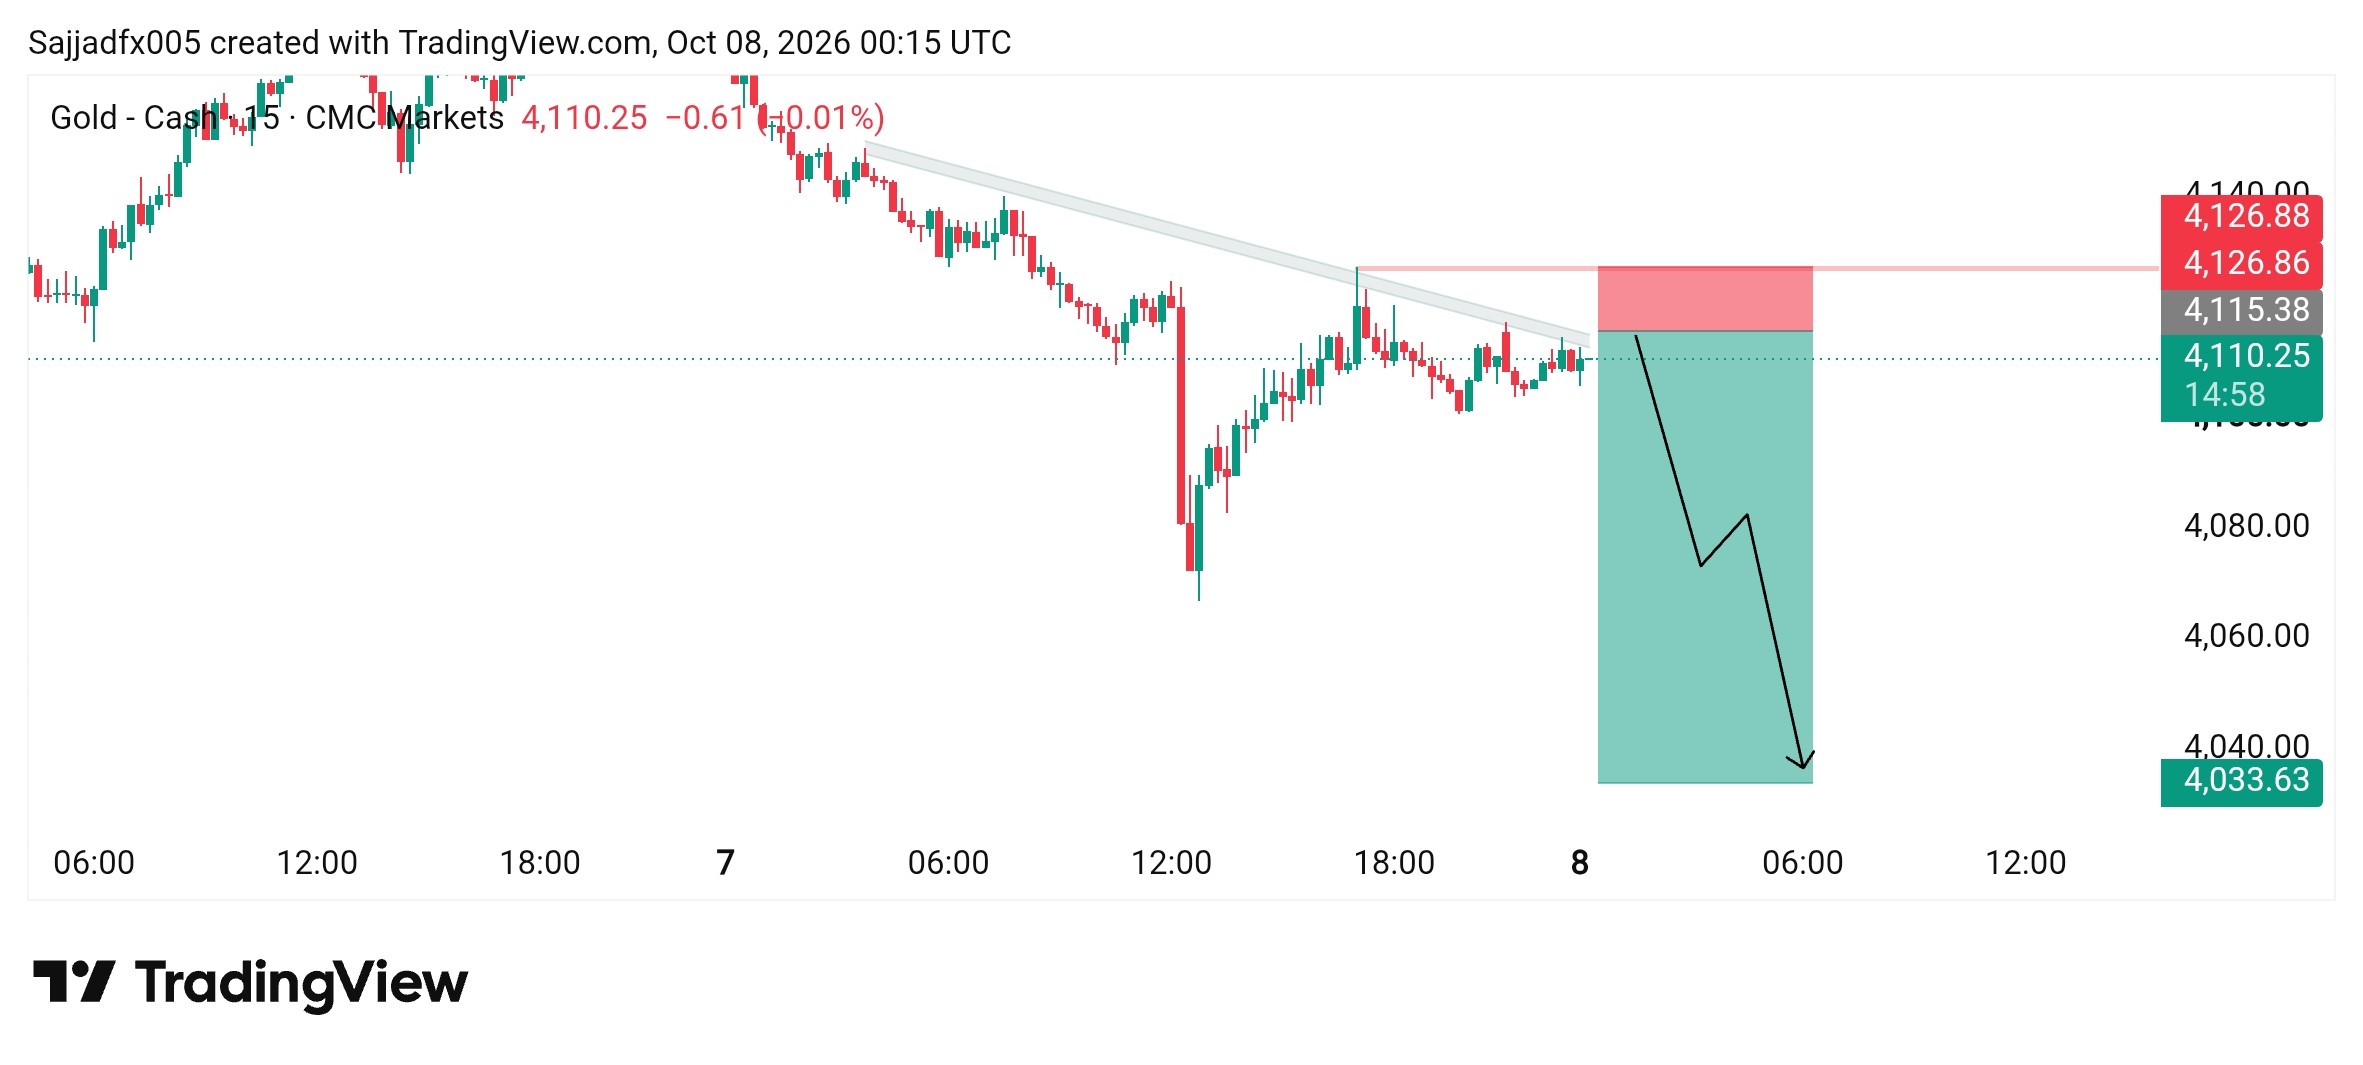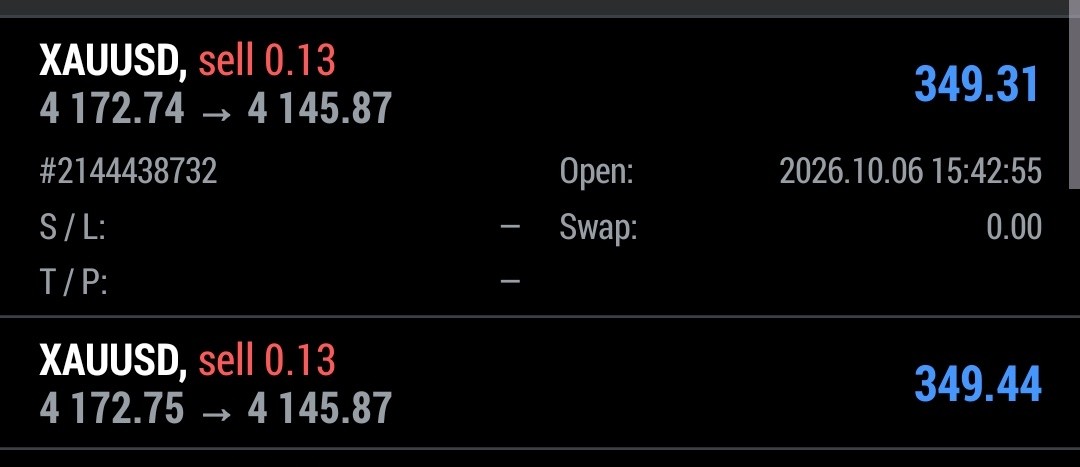
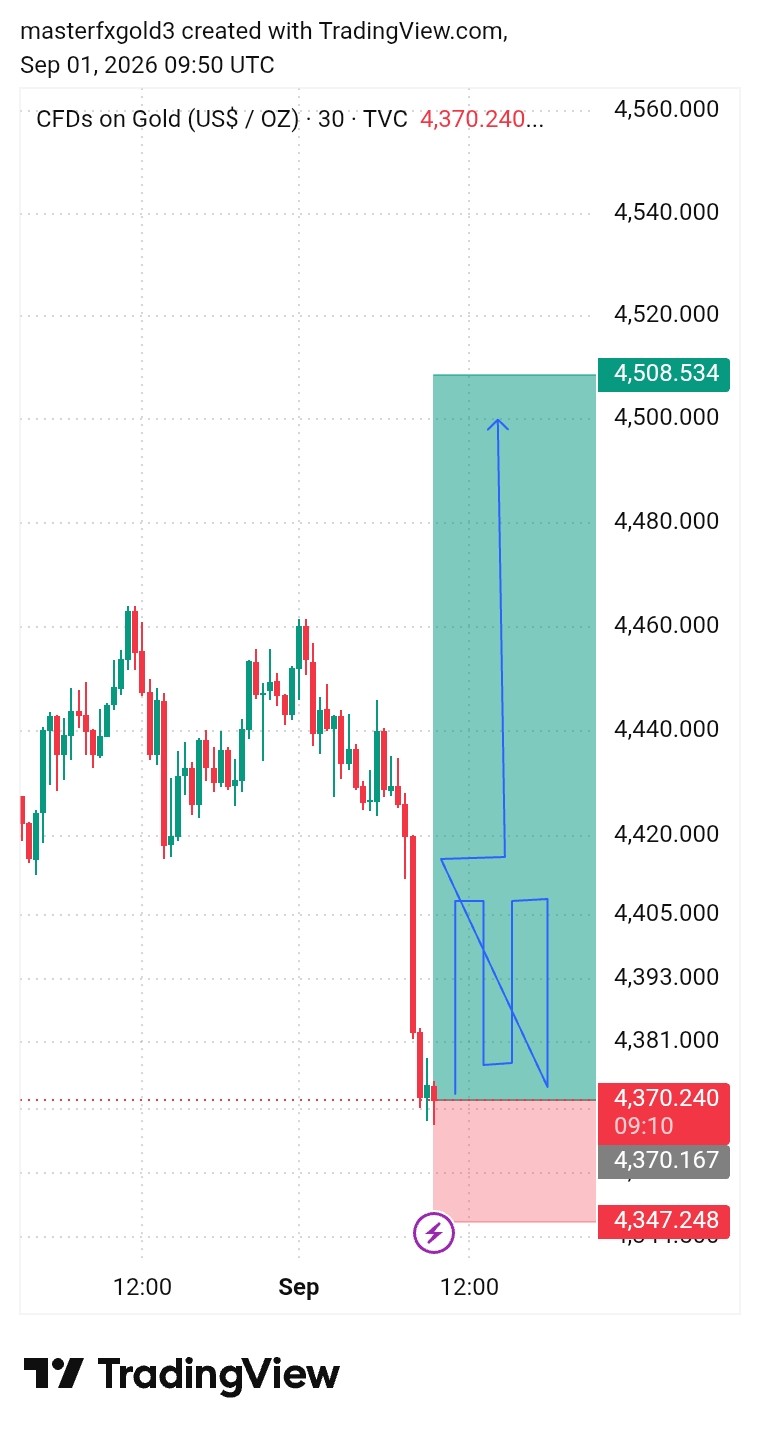
@masterfxgold3🚨 XAUUSD | GOLD BUY 🟢 📍 Entry: 4370 – 4365 ✅ TP 4375 ✅ TP 4380 ✅ TP 4385 ✅ TP 4390 ✅ TP 4395 ✅ TP 4400
View original post@masterfxgold3🚨 XAUUSD | GOLD BUY 🟢 📍 Entry: 4370 – 4365 ✅ TP 4375 ✅ TP 4380 ✅ TP 4385 ✅ TP 4390 ✅ TP 4395 ✅ TP 4400
View original postPhoto by @masterfxgold3· Sep 1, 2026· Post Malone
The image is a financial chart displaying candlestick patterns for CFDs on Gold. A blue line with an upward arrow indicates a predicted price movement, with a shaded teal area showing the target range. The chart has a clean, data-driven aesthetic. ON-SCREEN TEXT: masterfxgold3 created with TradingView.com, Sep 01, 2026 09:50 UTC CFDs on Gold (US$ / OZ) · 30 · TVC 4,370.240 4,560.000 4,540.000 4,520.000 4,508.534 4,500.000 4,480.000 4,460.000 4,440.000 4,420.000 4,405.000 4,393.000
@masterfxgold3🚨 XAUUSD | GOLD BUY 🟢 📍 Entry: 4370 – 4365 ✅ TP 4375 ✅ TP 4380 ✅ TP 4385 ✅ TP 4390 ✅ TP 4395 ✅ TP 4400
View original postPhoto by @masterfxgold3· Sep 1, 2026· Post Malone
The image is a financial chart displaying candlestick patterns for CFDs on Gold. A blue line with an upward arrow indicates a predicted price movement, with a shaded teal area showing the target range. The chart has a clean, data-driven aesthetic. ON-SCREEN TEXT: masterfxgold3 created with TradingView.com, Sep 01, 2026 09:50 UTC CFDs on Gold (US$ / OZ) · 30 · TVC 4,370.240 4,560.000 4,540.000 4,520.000 4,508.534 4,500.000 4,480.000 4,460.000 4,440.000 4,420.000 4,405.000 4,393.000