About this photo
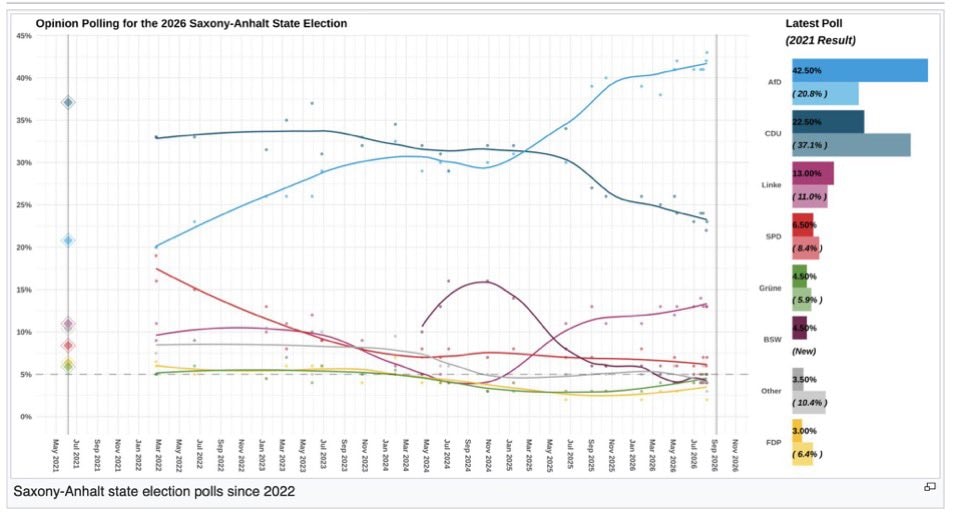
This is a data visualization of opinion polling for the 2026 Saxony-Anhalt State Election. The graph shows several lines representing different political parties' projected vote percentages over time, from May 2021 to November 2026. A bar chart on the right displays the latest poll results and the 2021 election results for comparison. The mood is informative and analytical. Visually notable are the diverging trends of the blue and teal lines, suggesting a significant shift in voter preference. The text "Opinion Polling for the 2026 Saxony-Anhalt State Election" is at the top, and "Saxony-Anhalt state election polls since 2022" is at the bottom. The right side shows "Latest Poll (2021 Result)" with party names like AfD, CDU, Linke, SPD, Grüne, BSW, Other, and FDP, along with their corresponding percentages.