About this photo
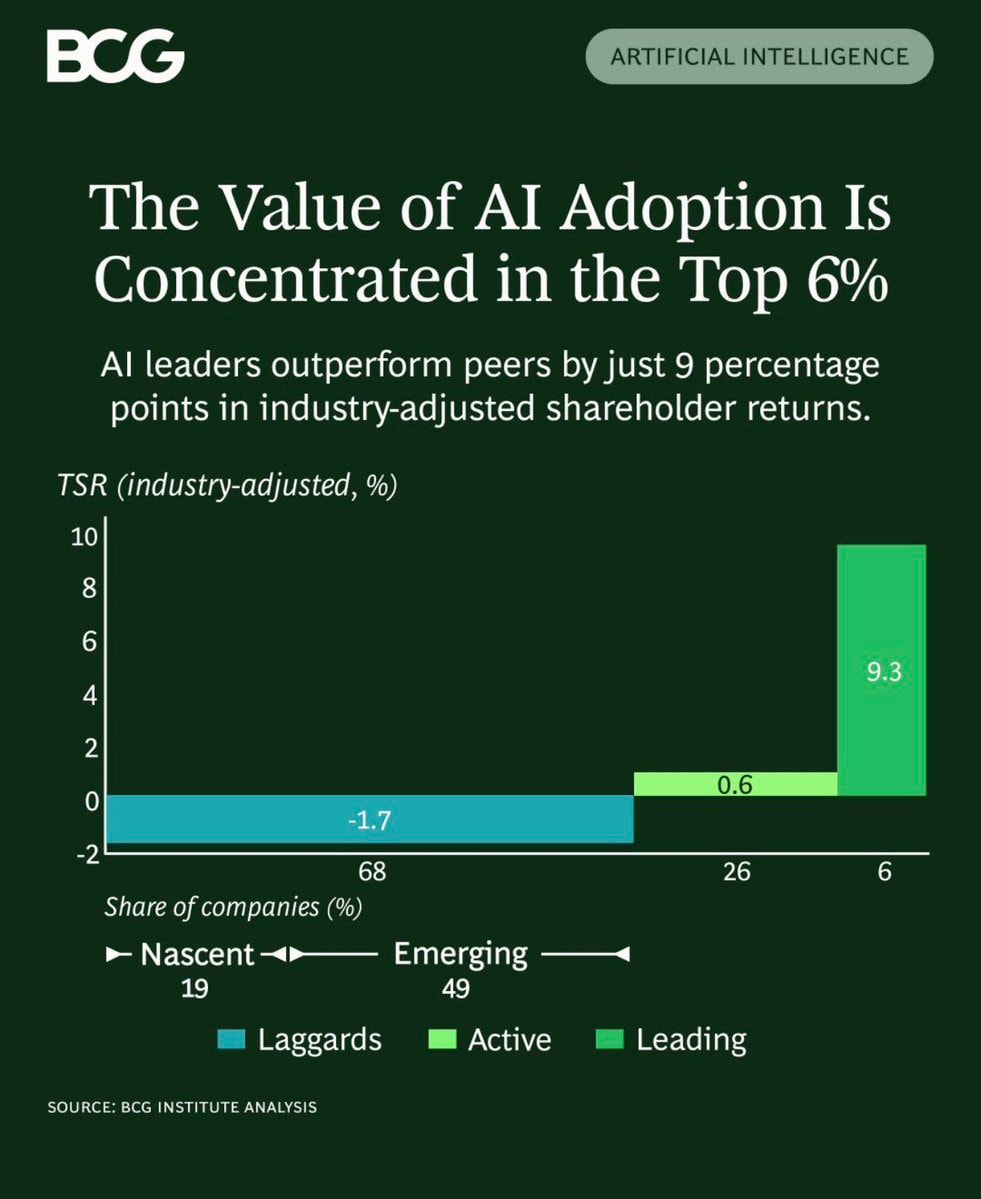
The image is a data visualization from BCG. It shows a bar chart illustrating the value of AI adoption concentrated in the top 6% of companies. The chart displays Total Shareholder Return (TSR) adjusted for industry, with different categories of companies represented by colored bars and percentages. The mood is informative and professional, typical of a business report. A notable detail is the stark contrast between the negative TSR of "Laggards" and the significantly higher TSR of "Leading" companies. ON-SCREEN TEXT: BCG ARTIFICIAL INTELLIGENCE The Value of AI Adoption Is Concentrated in the Top 6% AI leaders outperform peers by just 9 percentage points in industry-adjusted shareholder returns. TSR (industry-adjusted, %) 10 8 6 4 2 0 -2 -1.7 0.6 9.3 68 26 6 Share of companies (%) Nascent 19 Emerging 49 Laggards Active Leading SOURCE











No comments yet. Be the first!