
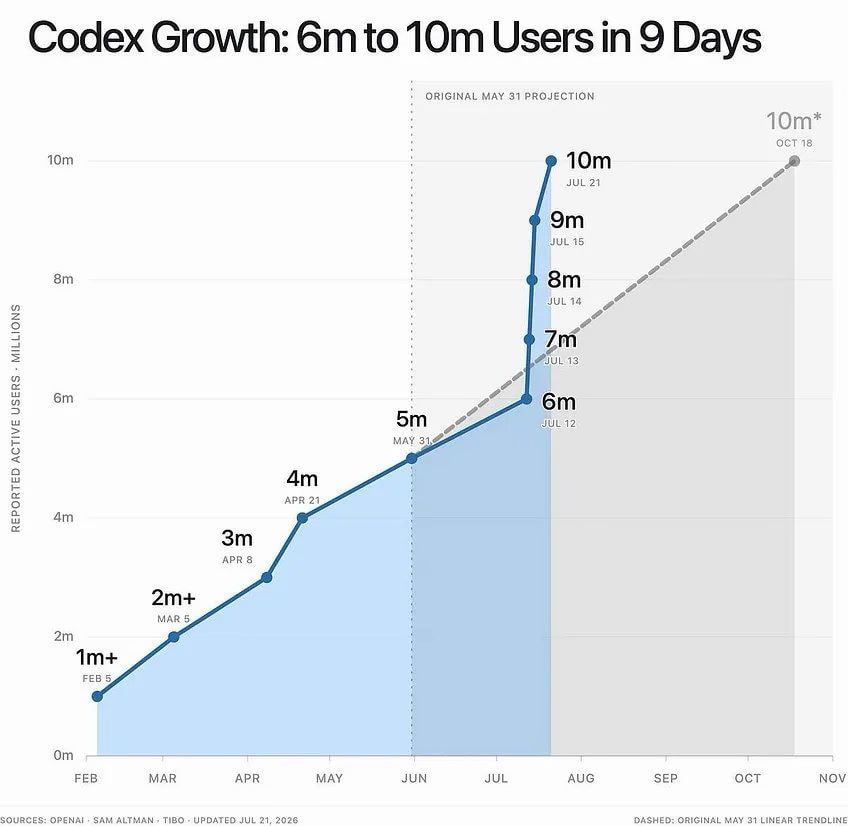
@nate_512Codex jumped from 6 million to 10 million users in 9 days flat and people are just flipping between claude code and codex like it's nothing. that consumer AI loyalty? doesn't exist. zero moat for any of these businesses
View original post@nate_512Codex jumped from 6 million to 10 million users in 9 days flat and people are just flipping between claude code and codex like it's nothing. that consumer AI loyalty? doesn't exist. zero moat for any of these businesses
View original postPhoto by @nate_512· Aug 6, 2026· Tech
The image is a line graph showing user growth. The graph displays two lines, one solid blue and one dashed gray, charting reported active users in millions against months from February to November. The solid blue line shows a rapid increase from 1m+ in February to 10m in July, with specific data points labeled with user counts and dates. The dashed gray line represents an "ORIGINAL MAY 31 PROJECTION" showing a slower growth trend. The mood is informative and data-driven, with a clean, minimalist aesthetic. A notable detail is the steep, almost vertical climb of the blue line between July 12th and July 21st, indicating explosive growth. ON-SCREEN TEXT: Codex Growth: 6m to 10m Users in 9 Days ORIGINAL MAY 31 PROJECTION 10m* OCT 18 10m JUL 21 9m JUL 15 8m JUL 14 7m JUL 13 6m
 4Apple original iPod 25th anniversary
 AI race shifts to power and permits
 NASA astronaut recruitment moon missions
 GTA 6 60FPS workaround setup
 2Ring Drone Cam and Ring Rover Cam
 2AI ticket machines on school buses
 LingBot-Touch robot testing
 2Senate iPhone contract roaming allowance
 Bitcoin price drop
 2Impossible Metals Eureka deep-sea robot
 genuine honeypot collection
 Altman scam allegation
 Rejected by HR and engineering
 Elon Musk poll question
 Efficient win math
 Gemini Memory summary feature
@nate_512Codex jumped from 6 million to 10 million users in 9 days flat and people are just flipping between claude code and codex like it's nothing. that consumer AI loyalty? doesn't exist. zero moat for any of these businesses
View original postPhoto by @nate_512· Aug 6, 2026· Tech
The image is a line graph showing user growth. The graph displays two lines, one solid blue and one dashed gray, charting reported active users in millions against months from February to November. The solid blue line shows a rapid increase from 1m+ in February to 10m in July, with specific data points labeled with user counts and dates. The dashed gray line represents an "ORIGINAL MAY 31 PROJECTION" showing a slower growth trend. The mood is informative and data-driven, with a clean, minimalist aesthetic. A notable detail is the steep, almost vertical climb of the blue line between July 12th and July 21st, indicating explosive growth. ON-SCREEN TEXT: Codex Growth: 6m to 10m Users in 9 Days ORIGINAL MAY 31 PROJECTION 10m* OCT 18 10m JUL 21 9m JUL 15 8m JUL 14 7m JUL 13 6m
4Apple original iPod 25th anniversaryAI race shifts to power and permitsNASA astronaut recruitment moon missionsGTA 6 60FPS workaround setup2Ring Drone Cam and Ring Rover Cam2AI ticket machines on school busesLingBot-Touch robot testing2Senate iPhone contract roaming allowanceBitcoin price drop2Impossible Metals Eureka deep-sea robotgenuine honeypot collectionAltman scam allegationRejected by HR and engineeringElon Musk poll questionEfficient win mathGemini Memory summary feature