
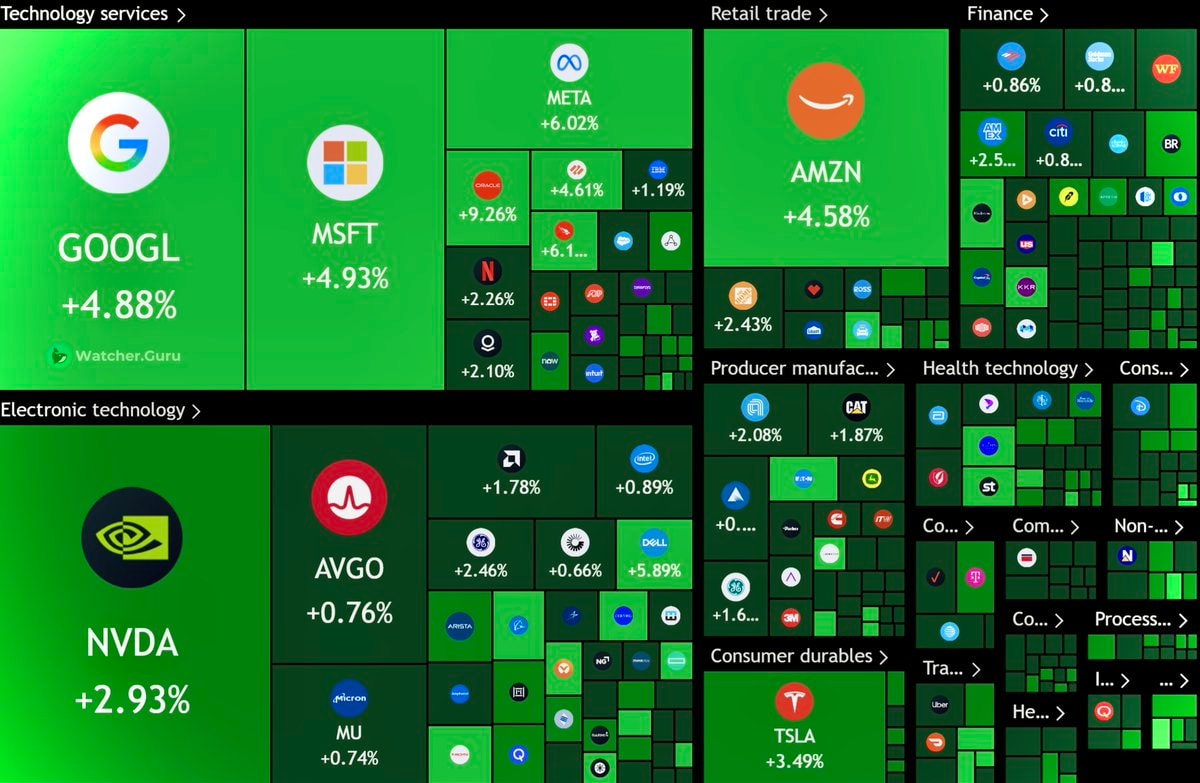
@Jakob.erasA trillion dollars of value just hit the US stock market in one session. The S&P 500 wrapped up at 7,600, with the big tech names all showing green on the heatmap
View original post@Jakob.erasA trillion dollars of value just hit the US stock market in one session. The S&P 500 wrapped up at 7,600, with the big tech names all showing green on the heatmap
View original postPhoto by @Jakob.eras· Aug 3, 2026· Google
The image is a financial data visualization, likely a stock market heatmap. It displays various company logos and stock performance metrics across different industries. The overall mood is informative and data-driven, with a clean, grid-like aesthetic. Notable elements include the prominent logos of Google, Microsoft, Amazon, and Nvidia, along with their respective percentage gains. The green color scheme indicates positive stock performance. ON-SCREEN TEXT: Technology services > GOOGL +4.88% Watcher.Guru MSFT +4.93% Electronic technology > NVDA +2.93% META +6.02% +4.61% +1.19% +9.26% +2.26% +2.10% Retail trade > AMZN +4.58% +2.43% Producer manufac... > CAT +1.87% +2.08% AVGO +0.76% +1.78% +0.89% +2.46% +0.6
 2Nicole Wallace THROTTLED casting
 2Amazon workers food stamps profit gap
 Belmont Cameli Macklin Celebrini Off Campus
 CBF Copa do Brasil broadcast rights deal
 2Amazon ground beef Prime deal
 Twitch and Amazon class action lawsuit
 Spider-Noir vs Friendly Neighborhood Spider-Man viewership
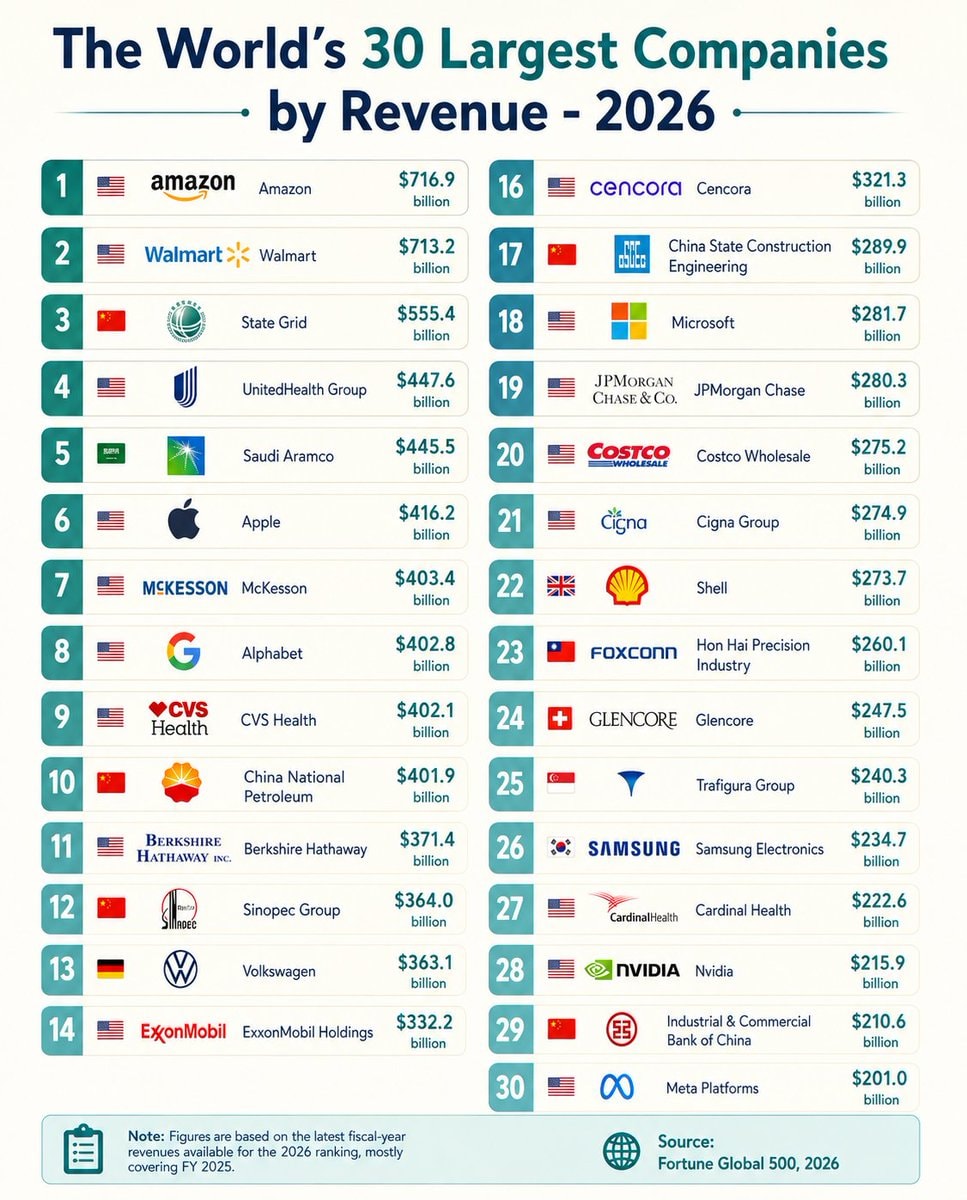 World's 30 Largest Companies by Revenue 2026
 2Amazon logo black orange
 2Amazon buying old rare books
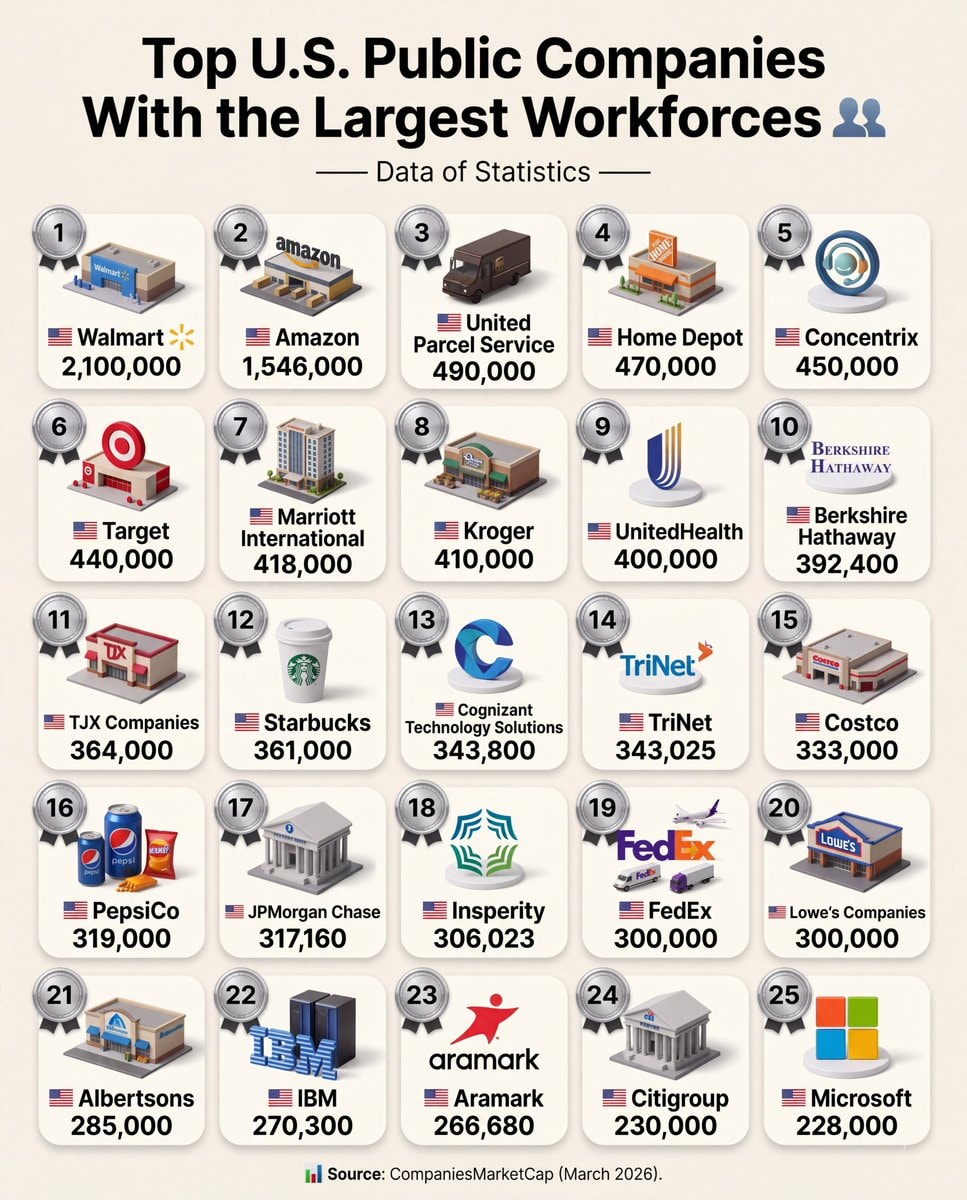 Top U.S. Public Companies Largest Workforces
 Twitch generative AI opt out setting
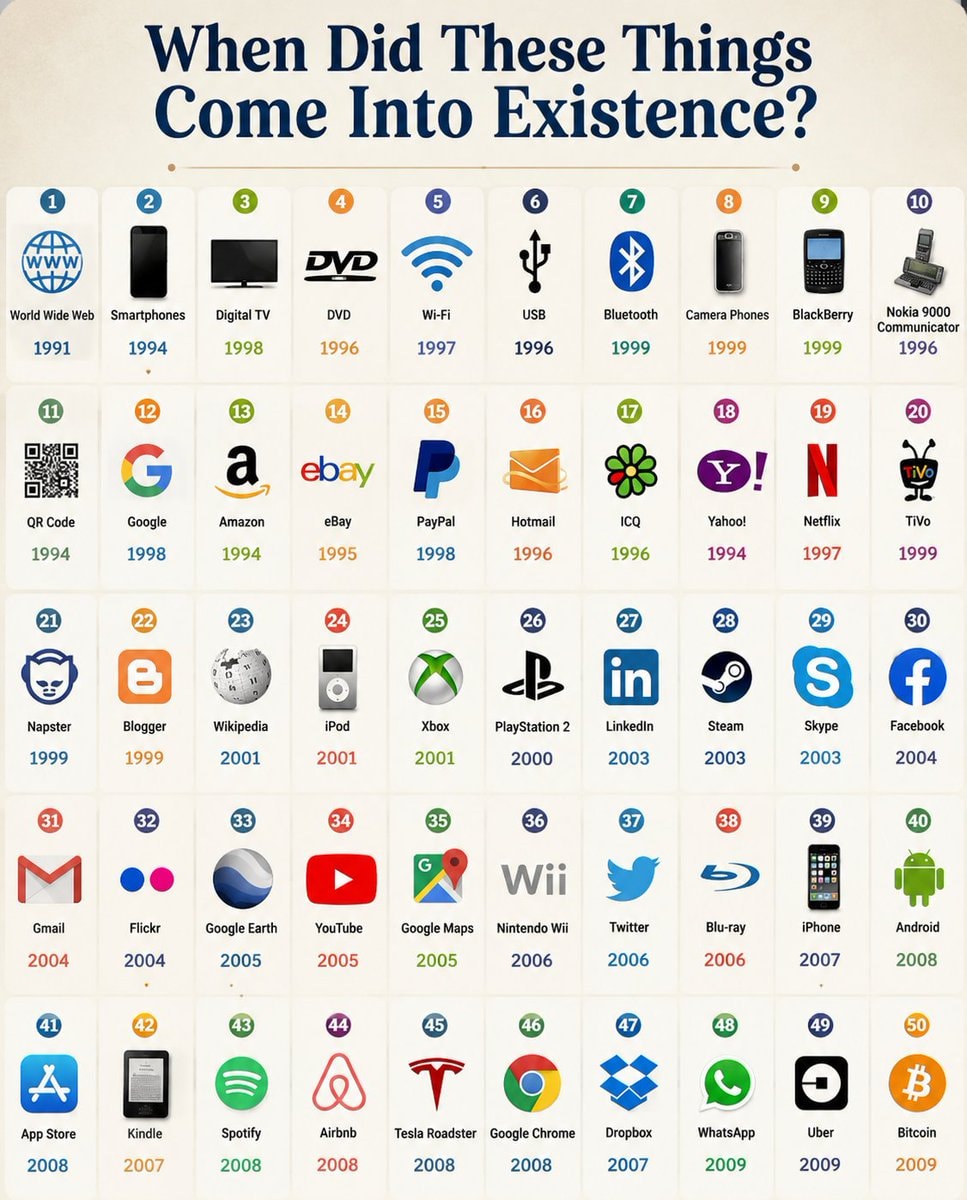 When did these things come into existence
 2Zohran Mamdani NYC bill Amazon contractors
 2Amazon data center Texas
 2Amazon hits $3 trillion market cap
 2Jim Cramer buy Amazon AMZN
 Bardigang celebrate AH HA chart success
@Jakob.erasA trillion dollars of value just hit the US stock market in one session. The S&P 500 wrapped up at 7,600, with the big tech names all showing green on the heatmap
View original postPhoto by @Jakob.eras· Aug 3, 2026· Google
The image is a financial data visualization, likely a stock market heatmap. It displays various company logos and stock performance metrics across different industries. The overall mood is informative and data-driven, with a clean, grid-like aesthetic. Notable elements include the prominent logos of Google, Microsoft, Amazon, and Nvidia, along with their respective percentage gains. The green color scheme indicates positive stock performance. ON-SCREEN TEXT: Technology services > GOOGL +4.88% Watcher.Guru MSFT +4.93% Electronic technology > NVDA +2.93% META +6.02% +4.61% +1.19% +9.26% +2.26% +2.10% Retail trade > AMZN +4.58% +2.43% Producer manufac... > CAT +1.87% +2.08% AVGO +0.76% +1.78% +0.89% +2.46% +0.6
2Nicole Wallace THROTTLED casting2Amazon workers food stamps profit gapBelmont Cameli Macklin Celebrini Off CampusCBF Copa do Brasil broadcast rights deal2Amazon ground beef Prime dealTwitch and Amazon class action lawsuitSpider-Noir vs Friendly Neighborhood Spider-Man viewershipWorld's 30 Largest Companies by Revenue 20262Amazon logo black orange2Amazon buying old rare booksTop U.S. Public Companies Largest WorkforcesTwitch generative AI opt out settingWhen did these things come into existence2Zohran Mamdani NYC bill Amazon contractors2Amazon data center Texas2Amazon hits $3 trillion market cap2Jim Cramer buy Amazon AMZNBardigang celebrate AH HA chart success