
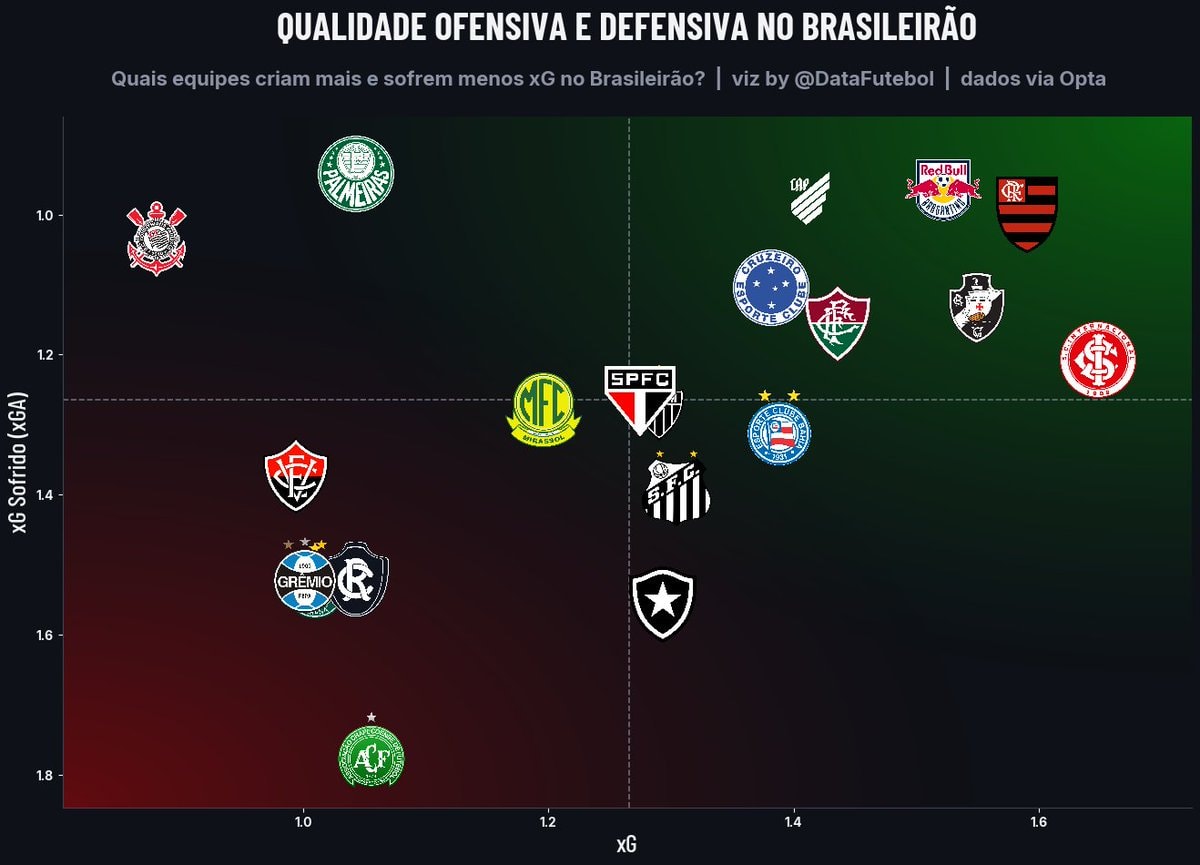
@kelpindigo_Scatter plot of xG vs xGA for Brasileirão teams. the lines show the league averages for each stat. how's your club looking?
View original post@kelpindigo_Scatter plot of xG vs xGA for Brasileirão teams. the lines show the league averages for each stat. how's your club looking?
View original postPhoto by @kelpindigo_· Jul 27, 2026· Brasileirão Série A
This is a data visualization chart showing offensive and defensive quality in the Brazilian league. Team logos are plotted on a scatter graph with xG (expected goals) on the horizontal axis and xGA (expected goals against) on the vertical axis. The background color transitions from red on the left to green on the right, indicating offensive performance, and from red at the bottom to green at the top, indicating defensive performance. Notable logos include Palmeiras, Corinthians, Flamengo, and Red Bull Bragantino. The title text reads "QUALIDADE OFENSIVA E DEFENSIVA NO BRASILEIRÃO" and the subtitle asks "Quais equipes criam mais e sofrem menos xG no Brasileirão? | viz by @DataFutebol | dados via Opta".
See all Brasileirão Série A photosRead the Brasileirão Série A wiki
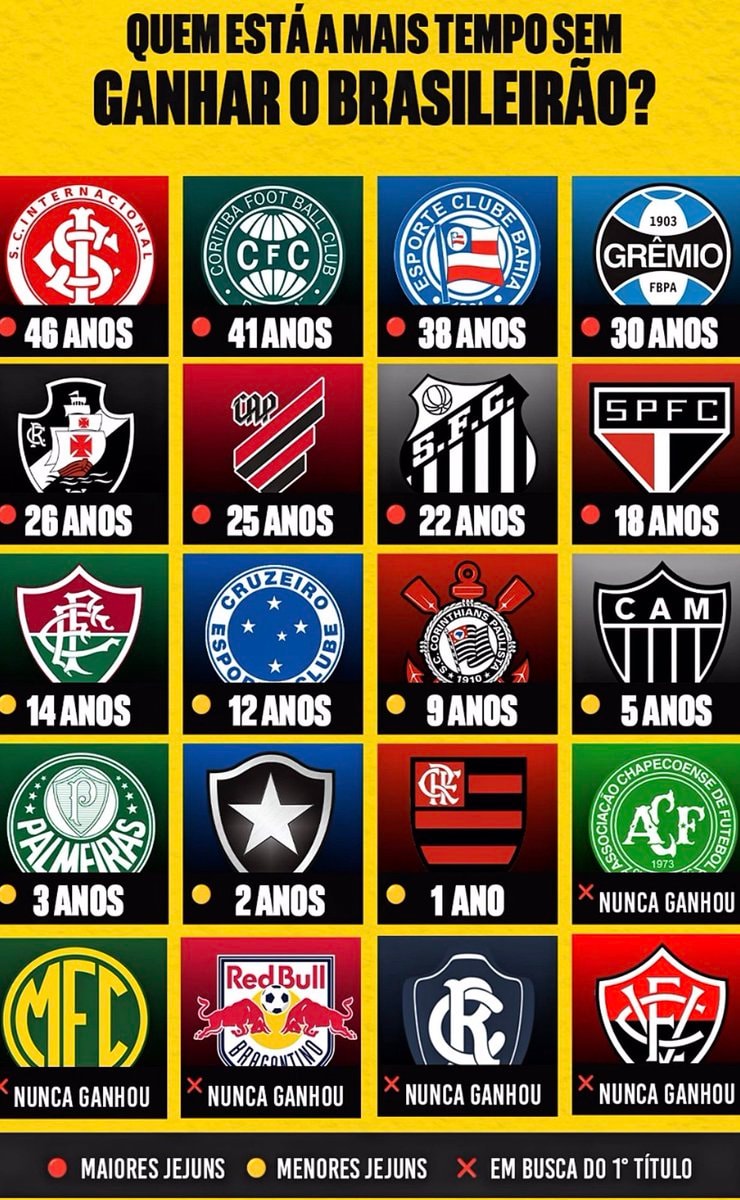 Brazilian football club Brasileirão droughts
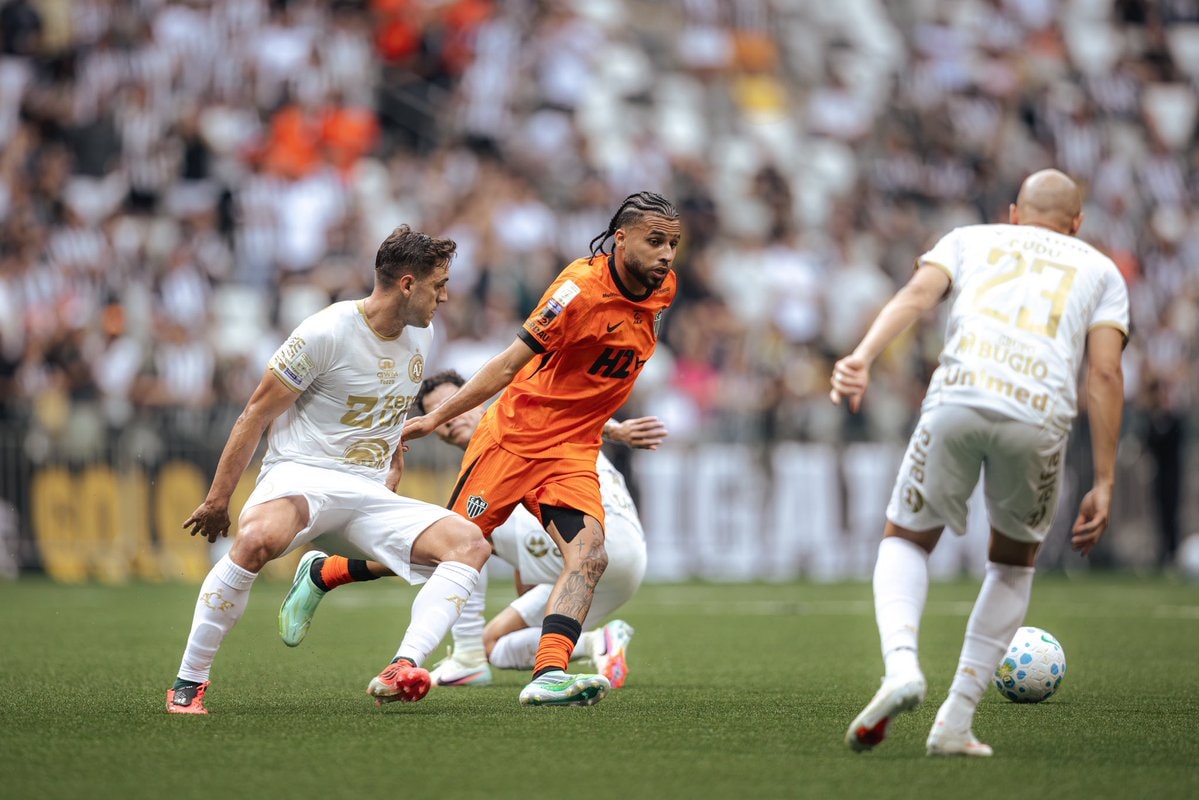 Atlético Mineiro vs Chapecoense stats
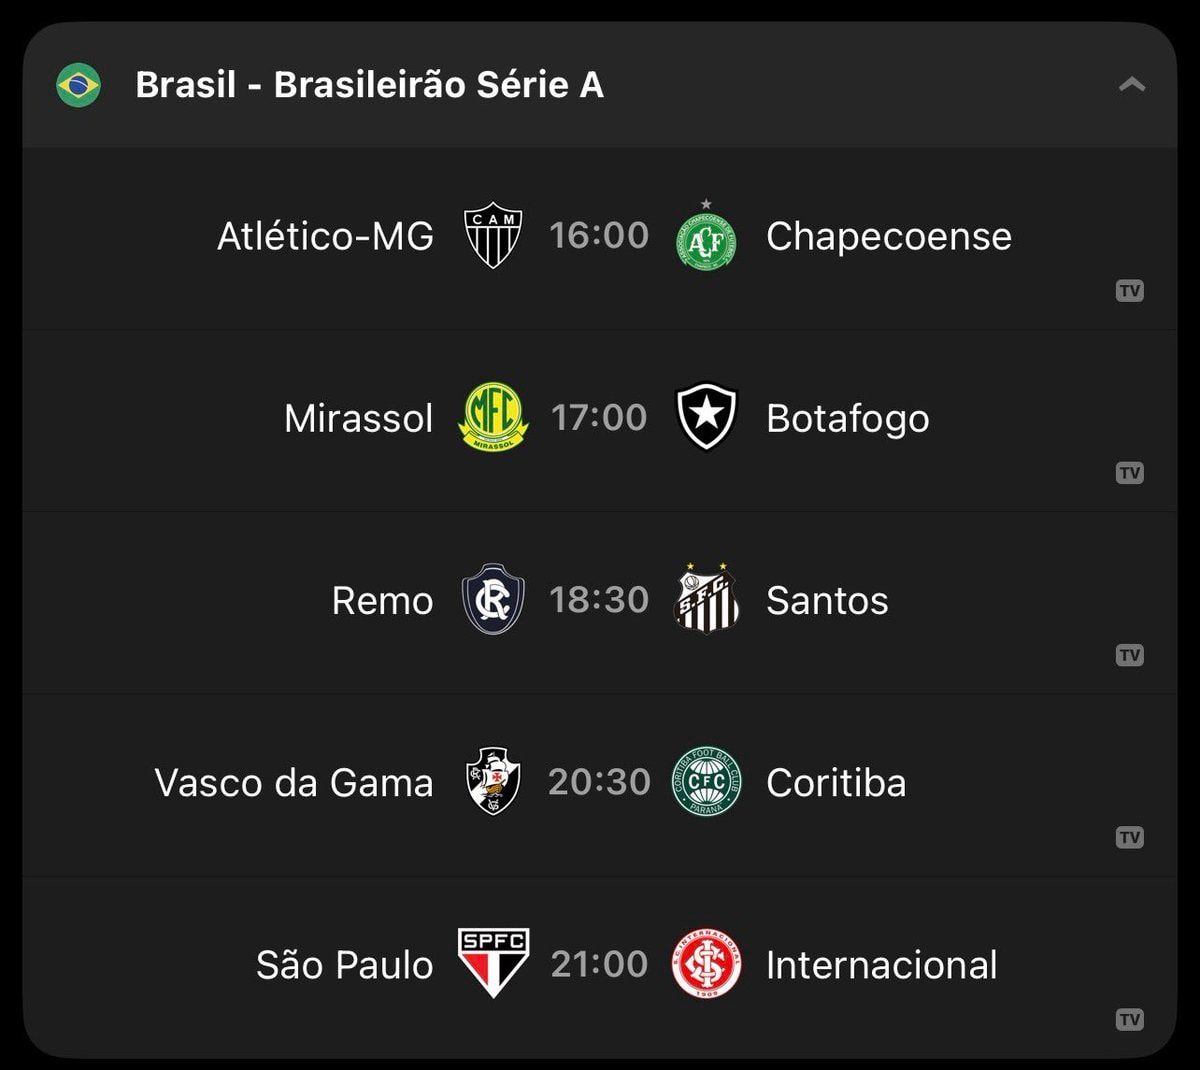 Brasileirão matches today
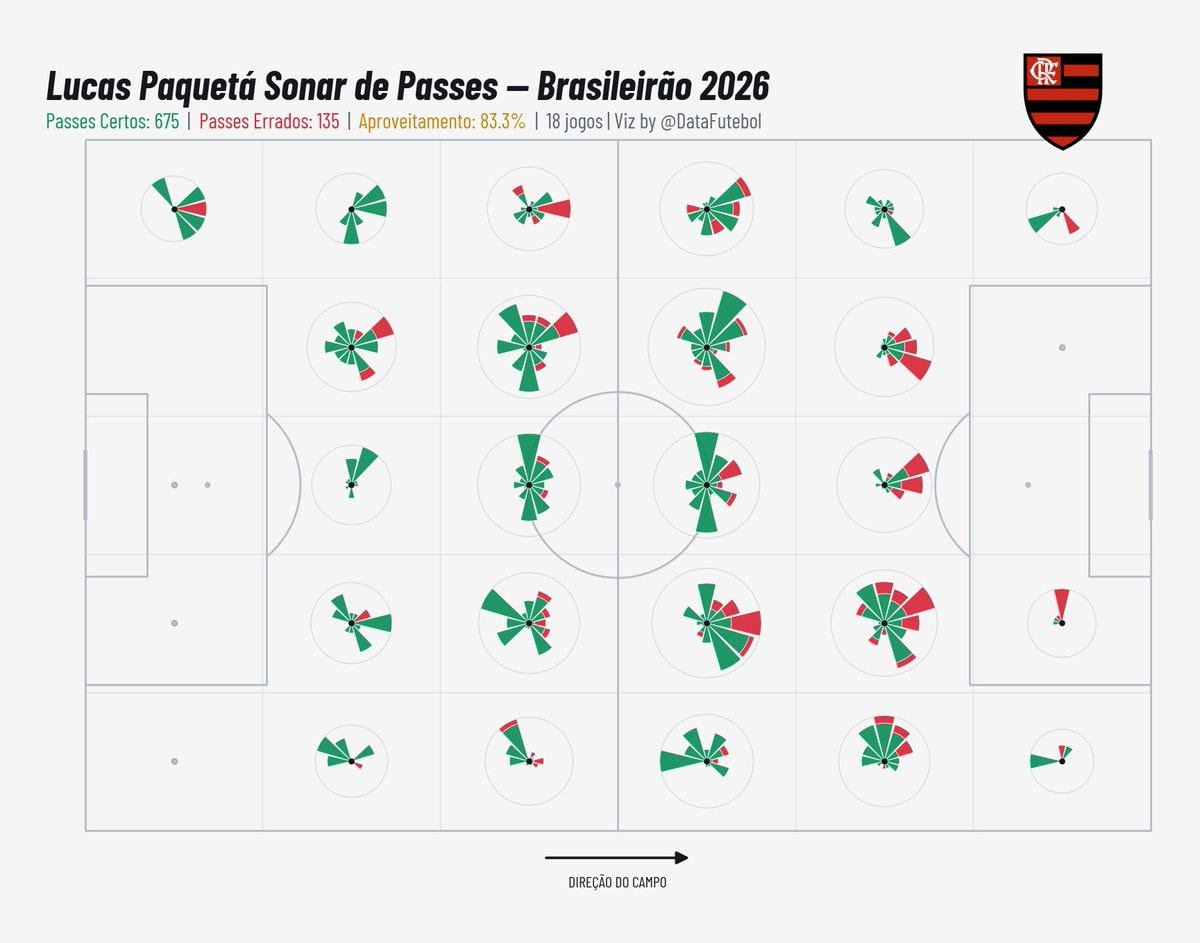 Lucas Paquetá Brazilian Championship pass map
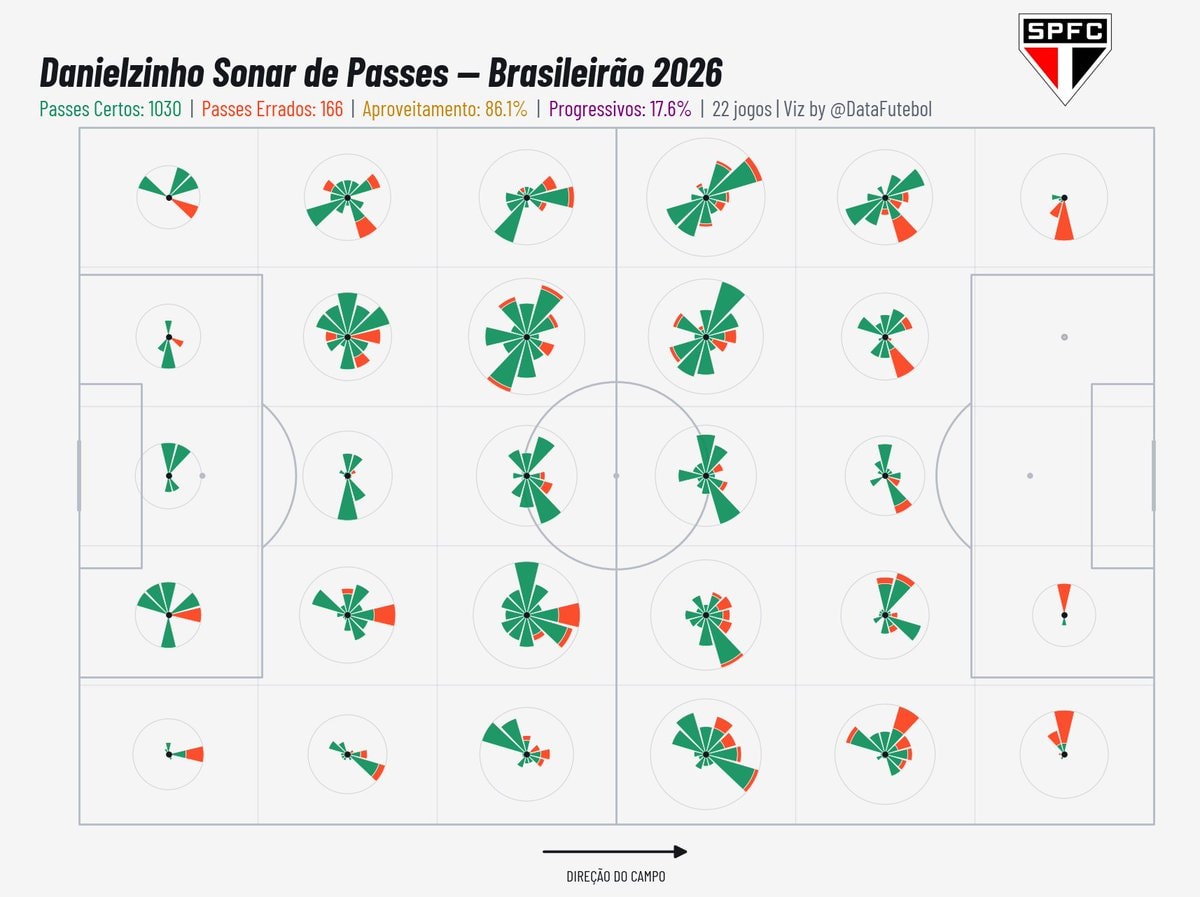 Danielzinho Brasileirão pass stats
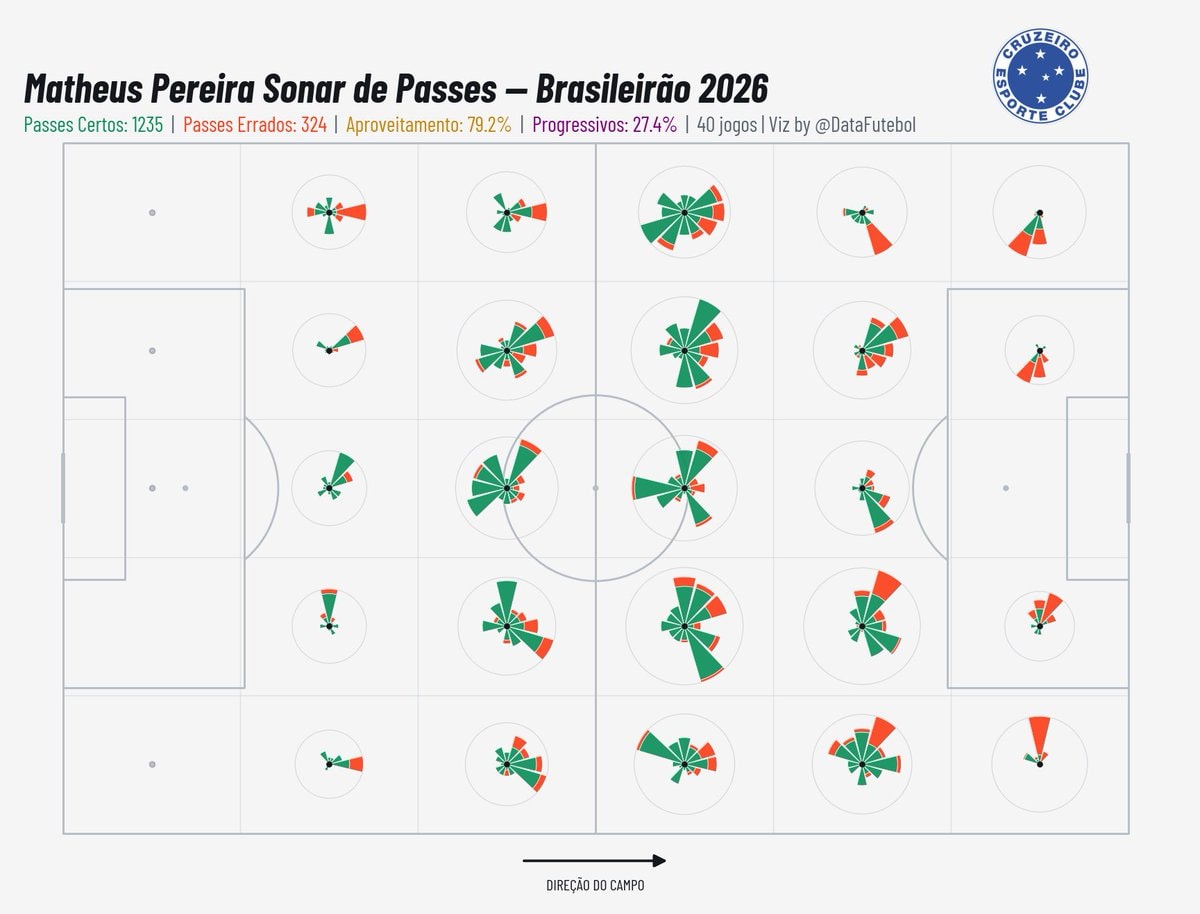 Matheus Pereira Brasileirão passing stats
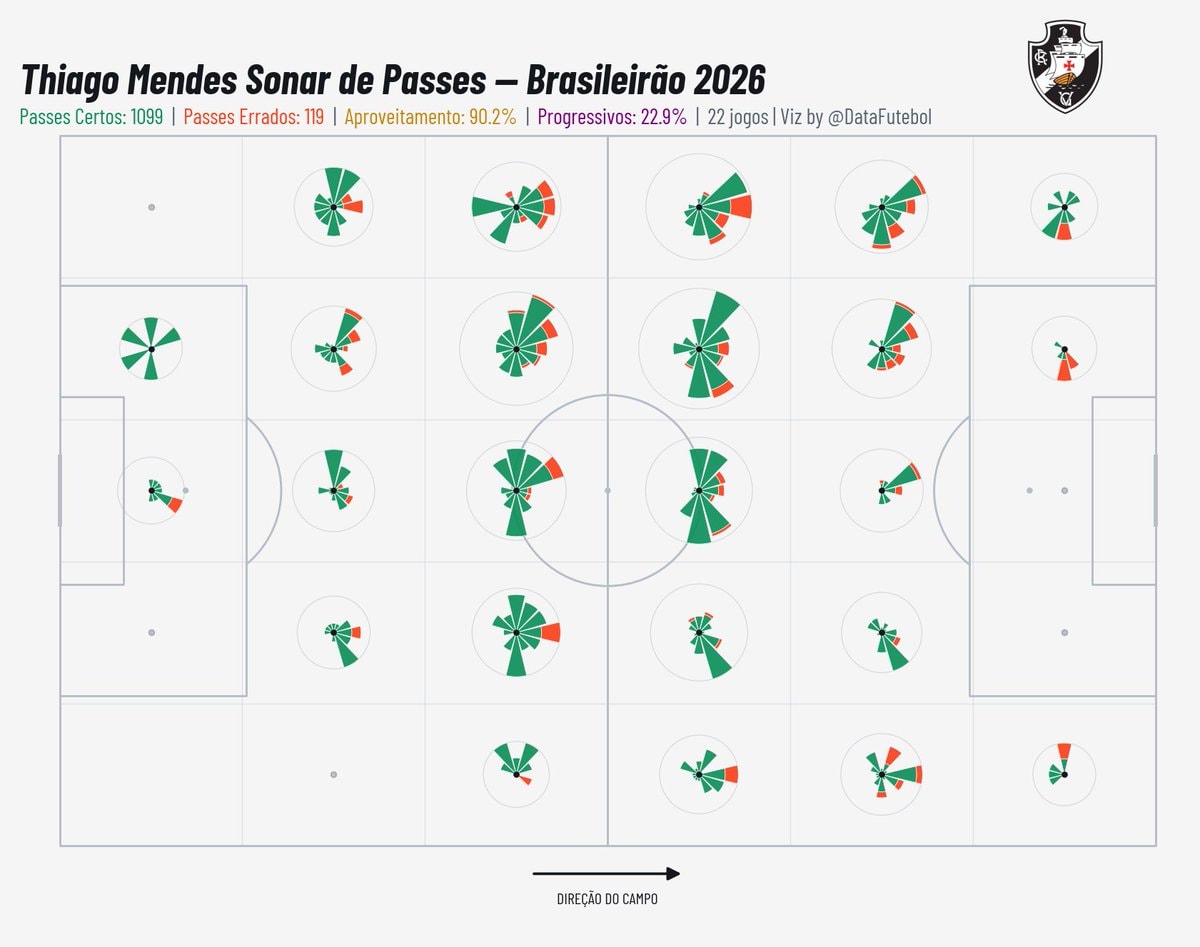 Thiago Mendes Vasco Brasileirão stats
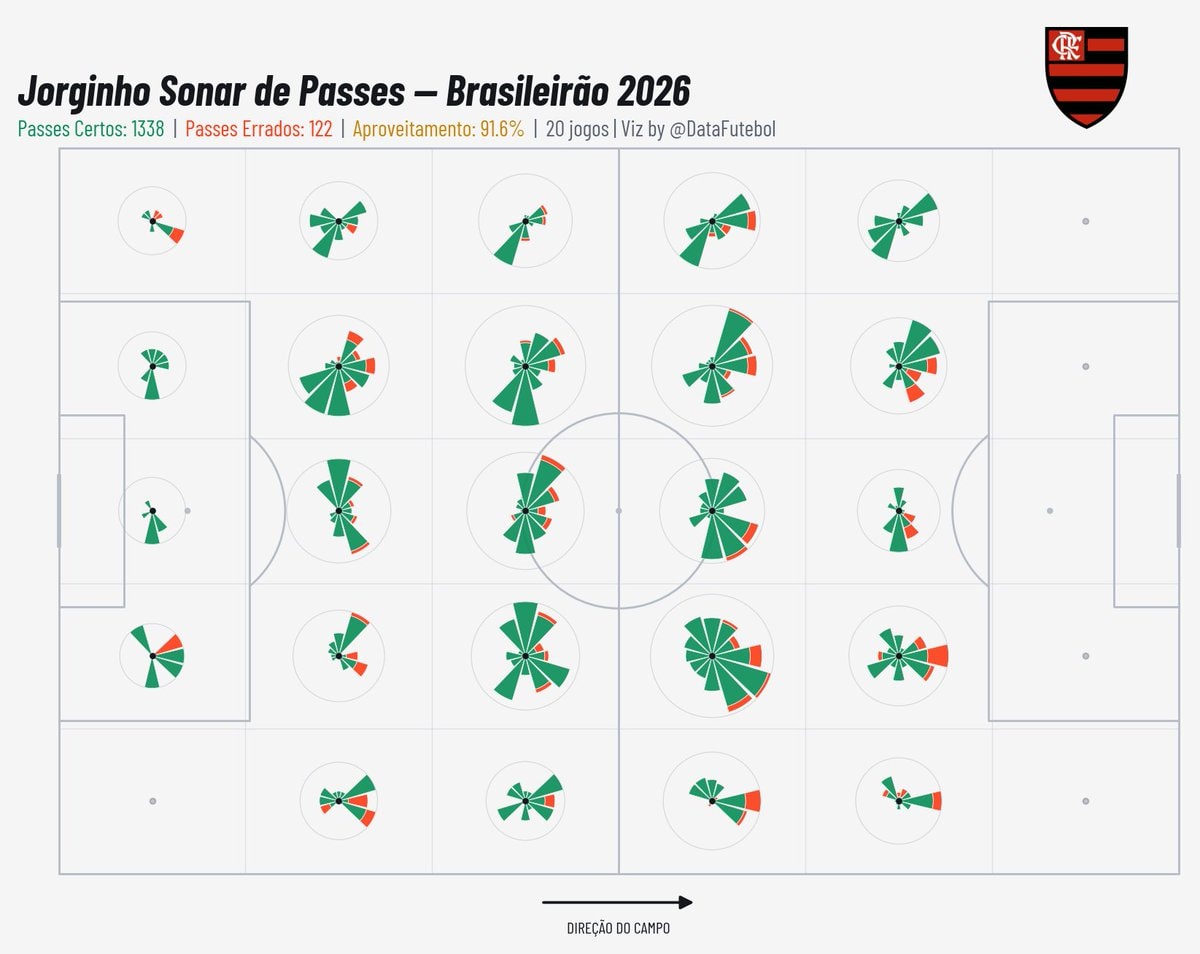 Jorginho Brasileirão 2026 Pass Direction
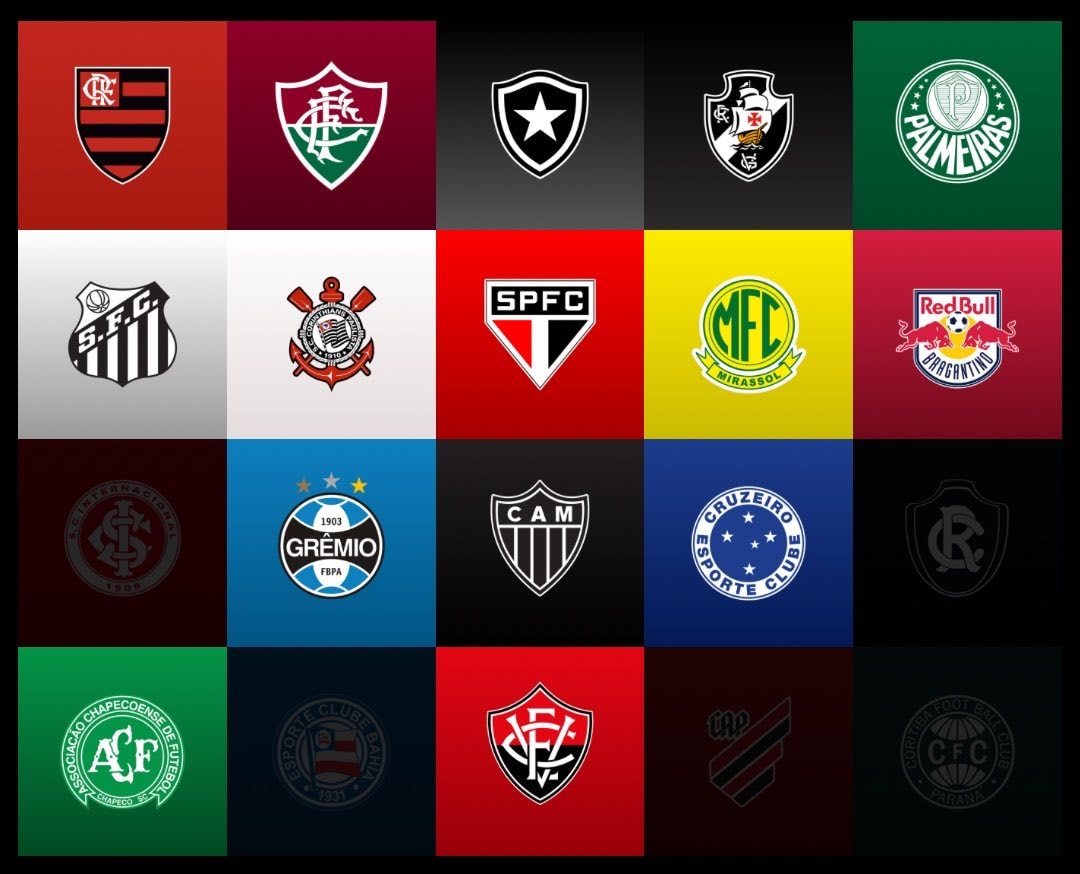 Brasileirão clubs betting ban stance
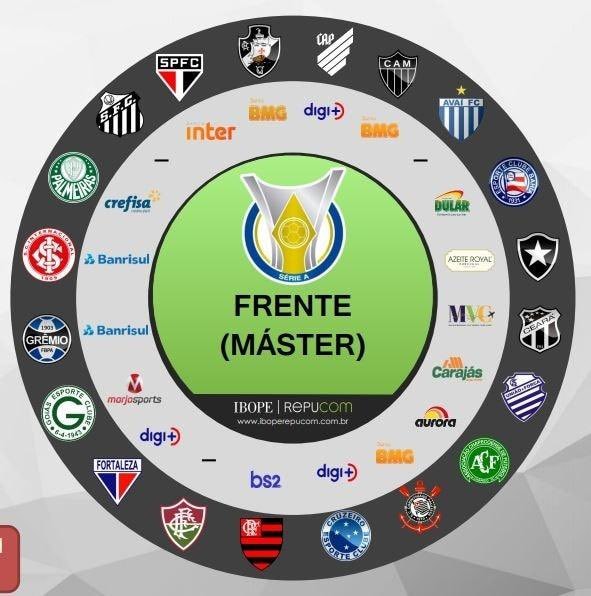 Serie A Frente Máster sponsorship data
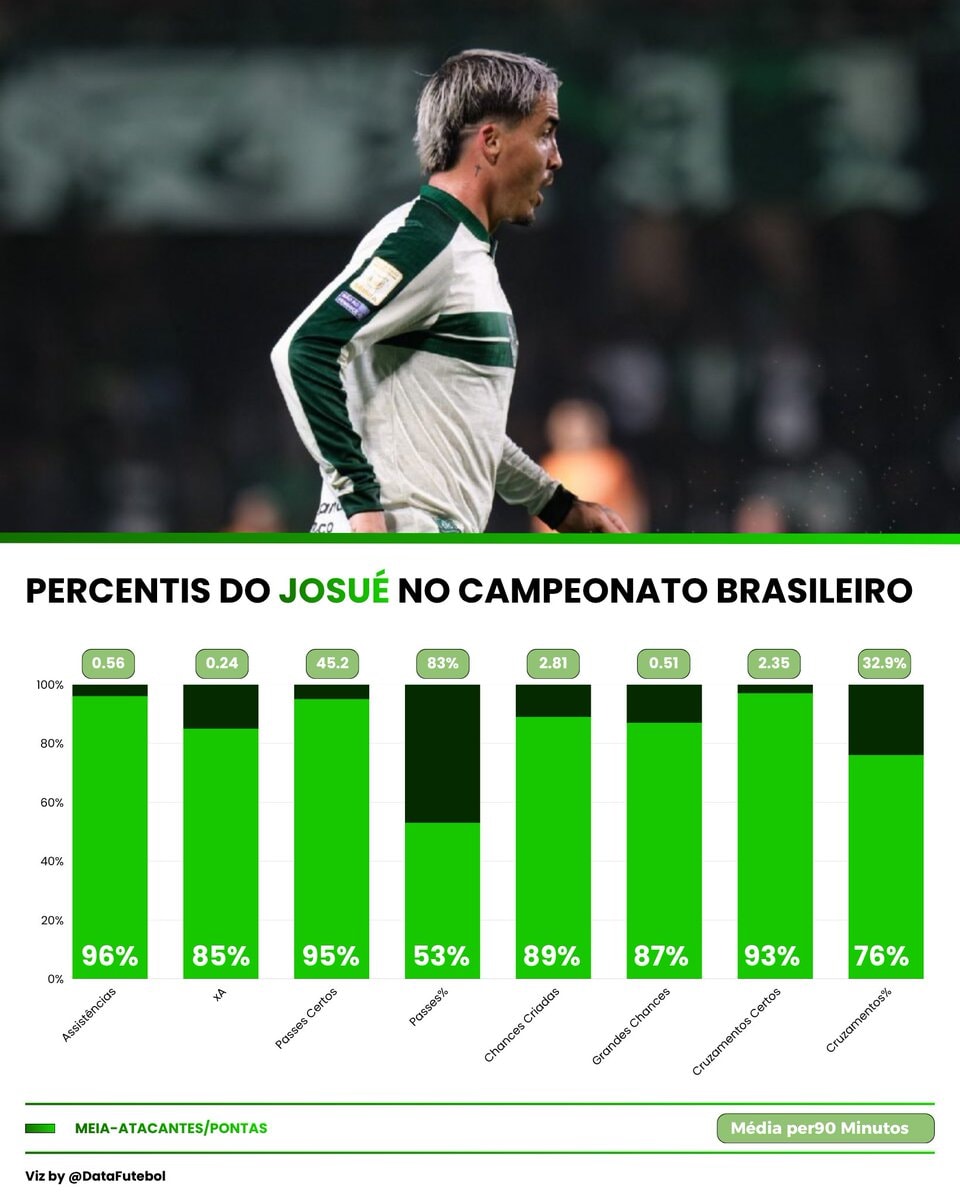 Josué @Coritiba passing stats
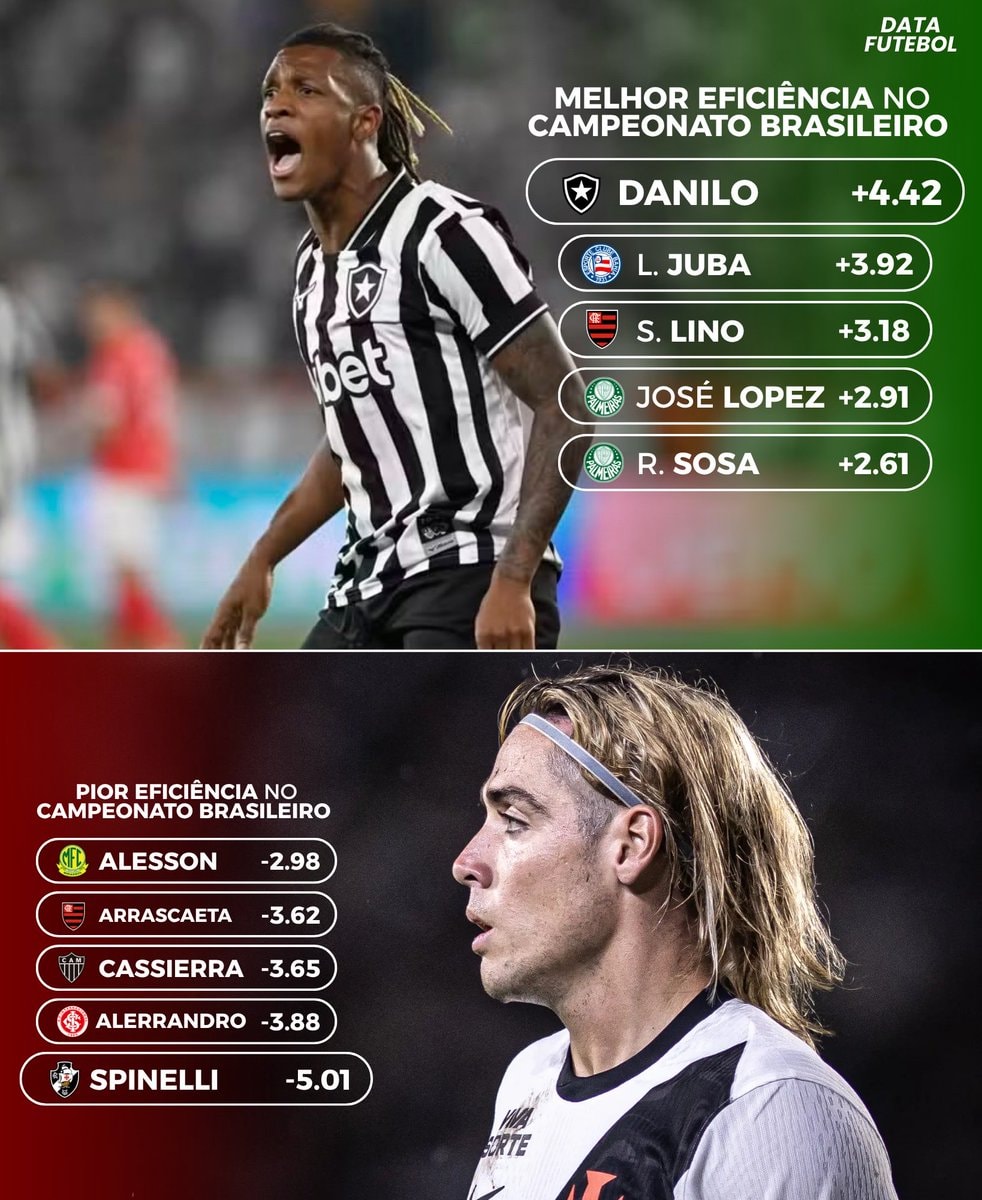 Danilo and Spinelli efficiency stats
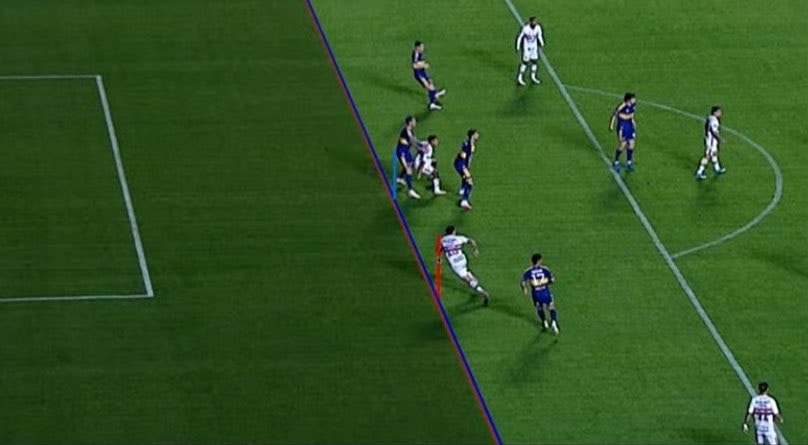 São Paulo offside line Brasileirão
 Brasileirão coaches fired
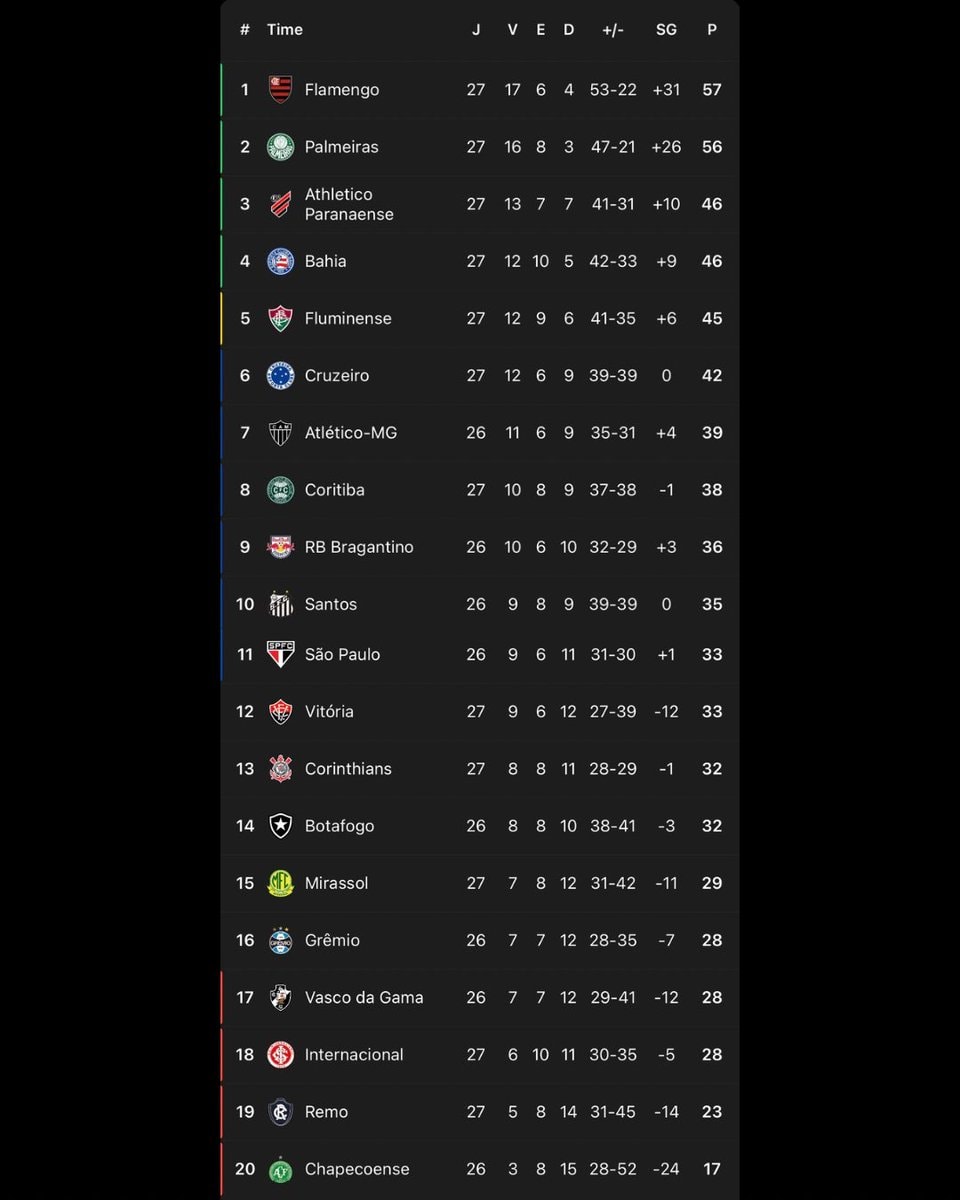 Brasileirão standings after round 27
 Brasileirão trophy and goal stats
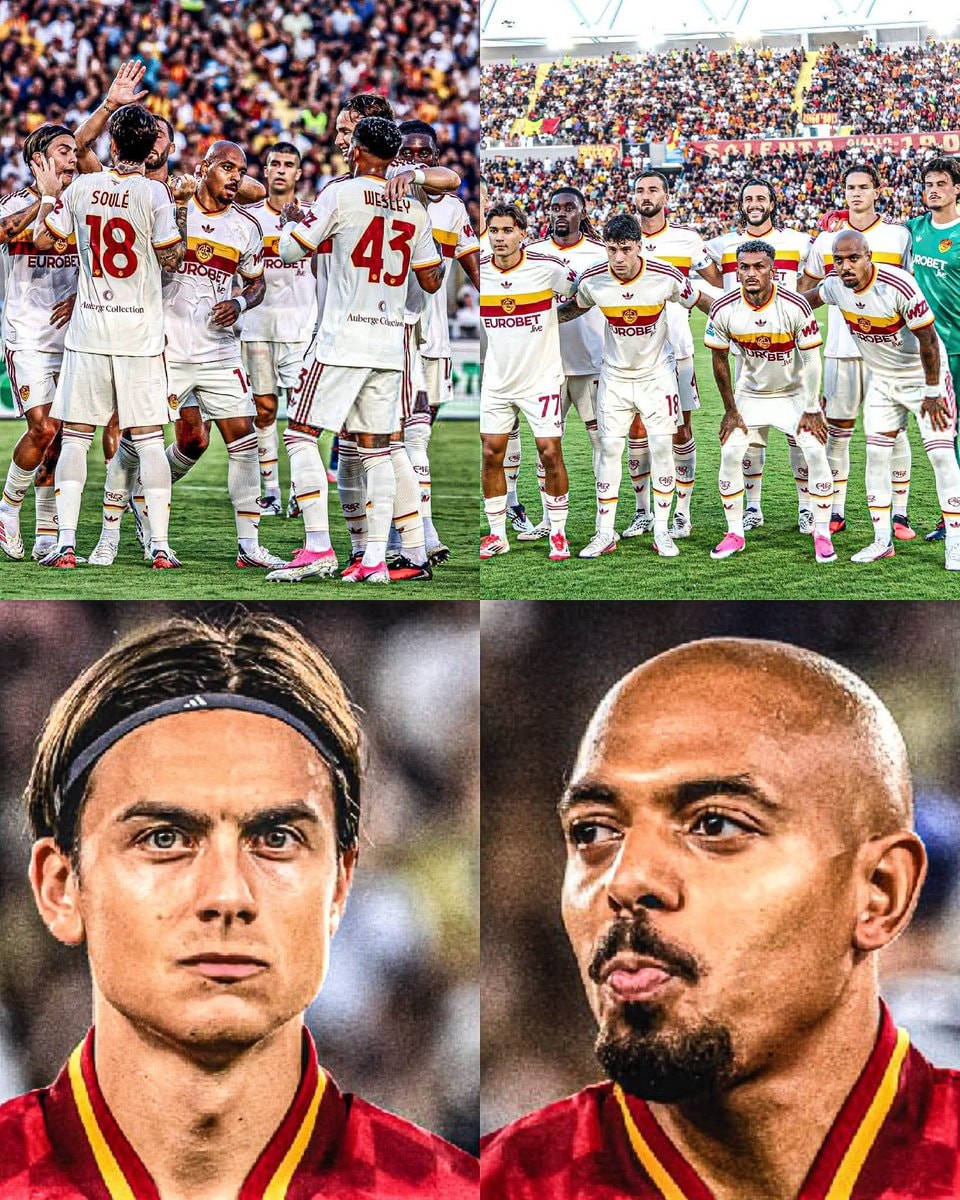 Roma top of Serie A under Gasperini
 Corinthians longest losing streak since 2006
@kelpindigo_Scatter plot of xG vs xGA for Brasileirão teams. the lines show the league averages for each stat. how's your club looking?
View original postPhoto by @kelpindigo_· Jul 27, 2026· Brasileirão Série A
This is a data visualization chart showing offensive and defensive quality in the Brazilian league. Team logos are plotted on a scatter graph with xG (expected goals) on the horizontal axis and xGA (expected goals against) on the vertical axis. The background color transitions from red on the left to green on the right, indicating offensive performance, and from red at the bottom to green at the top, indicating defensive performance. Notable logos include Palmeiras, Corinthians, Flamengo, and Red Bull Bragantino. The title text reads "QUALIDADE OFENSIVA E DEFENSIVA NO BRASILEIRÃO" and the subtitle asks "Quais equipes criam mais e sofrem menos xG no Brasileirão? | viz by @DataFutebol | dados via Opta".
See all Brasileirão Série A photosRead the Brasileirão Série A wiki
Brazilian football club Brasileirão droughtsAtlético Mineiro vs Chapecoense statsBrasileirão matches todayLucas Paquetá Brazilian Championship pass mapDanielzinho Brasileirão pass statsMatheus Pereira Brasileirão passing statsThiago Mendes Vasco Brasileirão statsJorginho Brasileirão 2026 Pass DirectionBrasileirão clubs betting ban stanceSerie A Frente Máster sponsorship dataJosué @Coritiba passing statsDanilo and Spinelli efficiency statsSão Paulo offside line BrasileirãoBrasileirão coaches firedBrasileirão standings after round 27Brasileirão trophy and goal statsRoma top of Serie A under GasperiniCorinthians longest losing streak since 2006