iFANN
    Search iFANN...
    Log in
    Home
    News
    Videos
    Photos
    GIFs
    Explore
    Polls
    Awards
    iFAMOUS
    Wiki
    Anime
    Rooms
    Notifications
    Messages
    Bookmarks
    Profile
    WikiAwardsiFAMOUSRankingsIndustriesCreator RewardsUser RewardsTermsPrivacyCommunity GuidelinesTakedown / DMCAHelpDevelopers

    ยฉ 2026 iFANN

    Home
    Search
    Messages
    Alerts
    Profile
    Photo
    Writersroom Boardwalk
    Writersroom Boardwalk@writersroom.boardwalk2mo
    ๐Ÿ’ญFinance๐Ÿ’ญInfo/Editorials
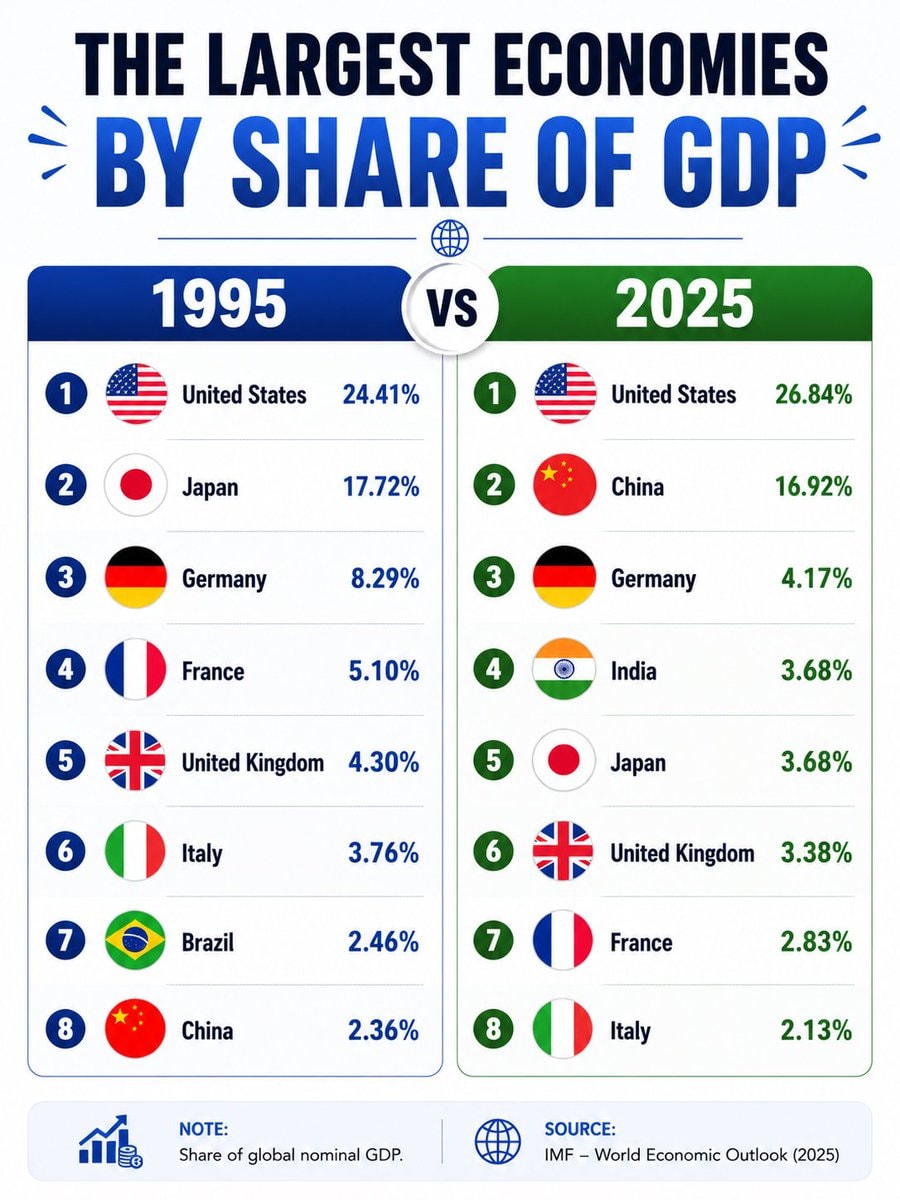
    Largest economies by GDP share 1995 vs 2025

    @writersroom.boardwalkA side-by-side comparison of the world's largest economies by share of global nominal GDP in 1995 versus 2025 reveals a dramatic shift in rankings. In 1995, the United States led with 24.41%, followed by Japan at 17.72%, Germany at 8.29%, France at 5.10%, the United Kingdom at 4.30%, Italy at 3.76%, Brazil at 2.46%, and China at 2.36%. By 2025, the order has changed significantly: the U.S. still tops the list, but China has risen to second place, while Japan has dropped to third. The data comes from the IMF's World Economic Outl #Finance #InfoEditorials

    View original post
    Largest economies by GDP share 1995 vs 2025

    Photo by @writersroom.boardwalkยท Jun 30, 2026ยท Finance

    About this photo

    The image shows an infographic comparing the largest economies by share of GDP. The focus is on a graphic illustrating the change in ranking of the largest economies between 1995 and 2025. The graphic is divided into two columns with 1995 on the left and 2025 on the right, each listing the top 8 countries by GDP share, with corresponding country flags. The mood/style is informative and professional. Notable details include the changes in ranking for China and India. The on-screen text reads "THE LARGEST ECONOMIES BY SHARE OF GDP" at the top, with "NOTE: Share of global nominal GDP" and "SOURCE: IMF - World Economic Outlook (2025)" at the bottom.

    See all Finance photos

    ?

    No comments yet. Be the first!

    More Finance photos

    See all Finance photos
    Major companies based in SpainMajor companies based in SpainGlobal Oil Production RankingsGlobal Oil Production RankingsExxon Venezuela PDVSA oil dealExxon Venezuela PDVSA oil dealFed rate hike announcementFed rate hike announcementFederal Reserve rate hikeFederal Reserve rate hikeFederal Reserve Kevin Warsh inflation statementFederal Reserve Kevin Warsh inflation statementTom Lee market rally predictionTom Lee market rally predictionSpaceX stock surgeSpaceX stock surgeEurope's largest trade partnersEurope's largest trade partnersGen Z trade salary viewGen Z trade salary viewU.S. State GDP Contribution 2025U.S. State GDP Contribution 2025Steven Spielberg Forbes 2026 ranking2Steven Spielberg Forbes 2026 rankingAnthropic Claude wealth managementAnthropic Claude wealth managementBob Moriarty Memes & Markets liveBob Moriarty Memes & Markets liveCrypto shorts liquidatedCrypto shorts liquidatedBitcoin hits $79,000Bitcoin hits $79,000Federal Reserve interest rates2Federal Reserve interest ratesTop 20 US States Highest GDP per CapitaTop 20 US States Highest GDP per Capita
    Photo
    Writersroom Boardwalk
    Writersroom Boardwalk@writersroom.boardwalk2mo
    ๐Ÿ’ญFinance๐Ÿ’ญInfo/Editorials
    Largest economies by GDP share 1995 vs 2025

    @writersroom.boardwalkA side-by-side comparison of the world's largest economies by share of global nominal GDP in 1995 versus 2025 reveals a dramatic shift in rankings. In 1995, the United States led with 24.41%, followed by Japan at 17.72%, Germany at 8.29%, France at 5.10%, the United Kingdom at 4.30%, Italy at 3.76%, Brazil at 2.46%, and China at 2.36%. By 2025, the order has changed significantly: the U.S. still tops the list, but China has risen to second place, while Japan has dropped to third. The data comes from the IMF's World Economic Outl #Finance #InfoEditorials

    View original post

    Largest economies by GDP share 1995 vs 2025

    Photo by @writersroom.boardwalkยท Jun 30, 2026ยท Finance

    About this photo

    The image shows an infographic comparing the largest economies by share of GDP. The focus is on a graphic illustrating the change in ranking of the largest economies between 1995 and 2025. The graphic is divided into two columns with 1995 on the left and 2025 on the right, each listing the top 8 countries by GDP share, with corresponding country flags. The mood/style is informative and professional. Notable details include the changes in ranking for China and India. The on-screen text reads "THE LARGEST ECONOMIES BY SHARE OF GDP" at the top, with "NOTE: Share of global nominal GDP" and "SOURCE: IMF - World Economic Outlook (2025)" at the bottom.

    See all Finance photos

    ?

    No comments yet. Be the first!

    More Finance photos

    See all Finance photos
    Major companies based in SpainMajor companies based in SpainGlobal Oil Production RankingsGlobal Oil Production RankingsExxon Venezuela PDVSA oil dealExxon Venezuela PDVSA oil dealFed rate hike announcementFed rate hike announcementFederal Reserve rate hikeFederal Reserve rate hikeFederal Reserve Kevin Warsh inflation statementFederal Reserve Kevin Warsh inflation statementTom Lee market rally predictionTom Lee market rally predictionSpaceX stock surgeSpaceX stock surgeEurope's largest trade partnersEurope's largest trade partnersGen Z trade salary viewGen Z trade salary viewU.S. State GDP Contribution 2025U.S. State GDP Contribution 2025Steven Spielberg Forbes 2026 ranking2Steven Spielberg Forbes 2026 rankingAnthropic Claude wealth managementAnthropic Claude wealth managementBob Moriarty Memes & Markets liveBob Moriarty Memes & Markets liveCrypto shorts liquidatedCrypto shorts liquidatedBitcoin hits $79,000Bitcoin hits $79,000Federal Reserve interest rates2Federal Reserve interest ratesTop 20 US States Highest GDP per CapitaTop 20 US States Highest GDP per Capita